What does this mean for the next 12 months?
Overall, we think the pricing and positioning set up coming into year-end and 2023 is thus more favorable than that seen coming into 2022: referencing purely equities, implied volatility is below realized volatility in several markets, realized and implied volatility are generally around long-run averages, skew is relatively low and there is still a troubling macro backdrop. Relative to other asset classes, equity index implied volatility also looks to have undershot so far. If we do see more drama over the coming months, equities seem to us to be very much at risk and we expect to see more trading opportunities.
Indeed, it is worth remembering that the correction in equities so far looks relatively mild by historical standards. While all the talk is of recession risks, consensus estimates are still forecasting earnings growth next year. Most homeowners are yet to reset to higher mortgage interest costs, and most companies are yet to refinance at the new higher rates.
Bond yields have risen, but their future path is uncertain, and the diversification benefits relative to equities now look more questionable. It is important to remember that a large part of the move higher in rates has been simply a reversal of a shift lower in long-term rates seen in 2019 and the first half of 2020. That saw very long-term interest rates hit incredibly low levels. For example, US interest rate swaps had the 10-year rate, 10 years forward, at 1% in August 2020. Until late 2019 the rate had only below 2% for a brief period in mid-2016. Bear in mind the FOMC’s median projection of the long-run neutral rate was at 2.5% from mid-2019 and remains there today. 10-year US Treasury yields, now just below 4%, were rarely below 4% from 1993 to 2007, and averaged over 5%. During this time, core PCE inflation never exceeded 3% year-on-year (it is currently around 5%). Persistently positive real rates would be just a return to historical norms but could mean a permanent repricing of risk assets.
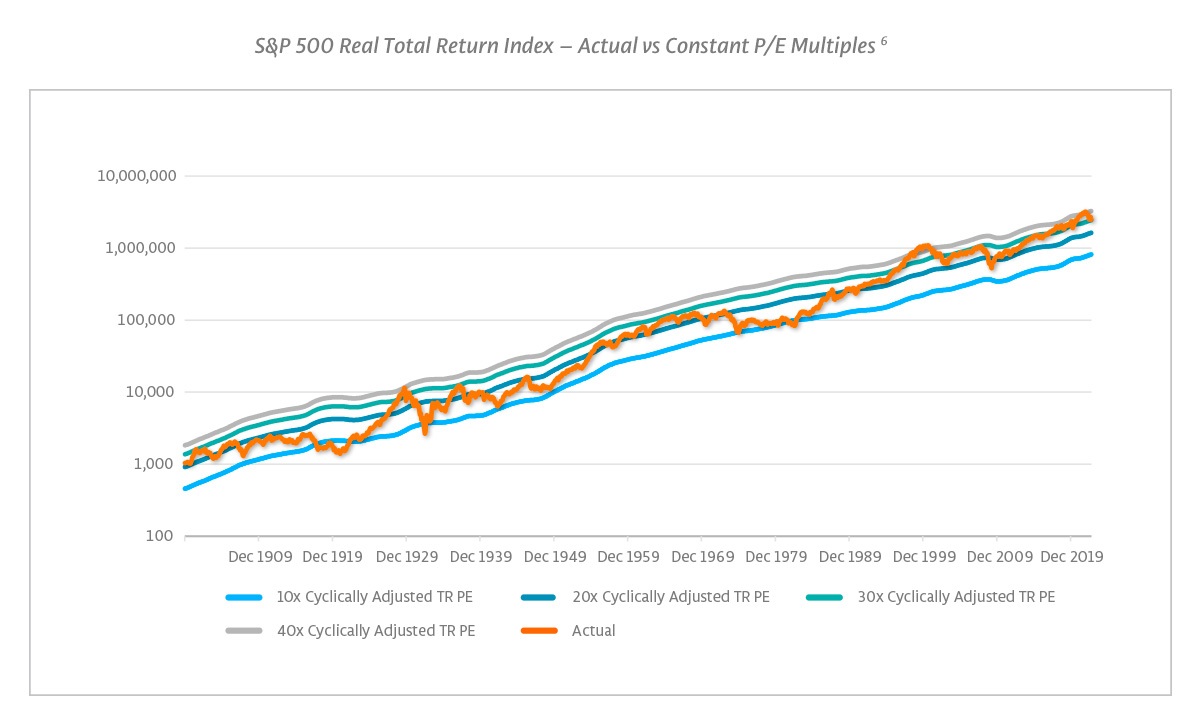
In the chart below, we borrow the approach of the widely followed cyclically adjusted total return P/E ratio created by Nobel Prize winning economist Robert Shiller. This has historically been a relatively good predictor of multi-year future returns. We then compare his series for the actual real market total return to ones based on constant P/E multiples. If we focus in on prior downturns, multiples typically compress more than we have seen thus far and, perhaps more worryingly, bottom out well below current levels. During the 2000-03 downturn, the cyclically adjusted total return P/E ratio approximately halved from 48 in December 1999 to 23 in March 2003. During the financial crisis, the ratio also approximately halved, from 29 in October 2007 to 15 in March 2009. At the end of 2021, the ratio was at 42. At the end of September, the ratio was at 31, roughly the starting point for the last financial crisis.
S&P 500 Real Total Return Index – Actual vs Constant P/E Multiples
But are markets just more efficient?
We are commonly asked whether markets have simply become more efficient, such that downturns can now happen in a more orderly fashion. It is always a good question to ask, and we are always researching to make improvements – and we hope research in 2022 will be incrementally additive to our 2023 returns. But in short, we think the answer is no, this is not a structural break in equity volatility behaviour. Looking over the long-term, 2022 is unusual but not unprecedented. Volatility does not spike 2020-style every time equities are down, and not every equity drawdown looks like Q1 2020. But 2022 has been odd. In periods like the early 2000s drawdown and in 2008, we saw both volatility spikes and some periods when equities declined without spikes. Post 2008, we saw periodic volatility disruptions amid a long bull market. Net, we are confident there will be enough movement in volatility over time to provide attractive trading opportunities. We are focused on deploying risk capital at the right time, continuous improvement and learning from the past without forgetting the lessons of a longer-term history.
One analogy we have observed with interest is 2008. As in 2008, housing seems to be potentially another downside risk, given the negative shock to affordability from interest rate rises. But it is more the path of information flow and market reaction that we find interesting. There were very widely known problems in US housing and credit markets by mid-2008, with subprime delinquencies at historical highs and several companies and buyside funds already having hit serious trouble (e.g. Bear Stearns’ hedge funds in Summer 2007, subprime lender Countrywide seeing its stock falling almost 80% in 2007, the Bear Stearns bailout in March 2008, ABX 2006 vintage single-A tranche trading below 50).7 However, markets were generally assuming the worst would be avoided. At the end of August 2008, the VIX was at 21. Indeed, on Friday 12th September, the close of business before the Lehman bankruptcy on the 15th, the VIX was at 26. Over the next 3 months it had an average level of 56 and peaked at over 80. In 2020 we saw something similar. Covid was a known risk, but widely assumed to be manageable. The VIX was at 14 on the 19th February 2020, and then averaged almost 50 over the next 2 months, again peaking at over 80.
We are not necessarily forecasting a 2008 or 2020 style crash, but rather cautioning against trusting too much in a linear extrapolation of the last 12 months, or current market pricing as a reliable forecast of a benign outcome. To come back to where we started with the World Cup, an unexpected loss for Argentina doesn’t suddenly mean that most managers would not want Messi and company on their teams.
Within equity volatility, the set up now offers more interesting opportunities, with various metrics suggesting to us that volatility could easily move sharply. In an environment where bond correlations are now highly uncertain, diversification is tough to find. We think that equity volatility strategies can play an important role for investors in the year ahead.
Now is a time when many investors are revisiting strategic and tactical asset allocation choices, in light of a shifting economic landscape, changing cost of capital and adjustments in fundamentals across many assets. One big question we see: if government bonds are no longer a clear hedge, should that mean less equities and risk assets in general, or new hedges? Should alpha orientated strategies play a larger role in overall asset allocations? In that light, equity volatility strategies can be very complimentary not only to equities but also to other types of diversifiers, as different types of market environment can favour different types of strategy. Equity volatility shone in both 2018 and Q1 2020, while 2022 has been the year of global macro and trend-following. Interestingly, we hear that profits in both macro and trend have generally come from capturing the large directional moves outside equities, rather than calling the equity downturn.8 That would align with our comments that equity behaviour has been atypical this year, while other asset classes have seen some outsized moves. We are always happy to see our fellow industry participants have success and over the long-term we believe there will be opportunities for many strategies, making them complimentary to one another. Will 2023 bring opportunities for all, or perhaps a shift in leadership?
Within equity volatility, we believe that after a period where apparently cheap trades have sometimes gotten cheaper, it is important to be disciplined in risk taking, to be actively scanning markets to find the best implementations of views, and to understand shifts in cross-market correlations. Markets could break suddenly, potentially offering outsized returns given current pricing. But you have to be engaged to be ready. Being in liquid markets and having co-CIOs split across the US and Asia gives us the ability to process news flow real-time across the world and to be able to engage with markets rapidly as opportunities arise, as we have done in the past. That enables the implementation of a wider range of trades and more dynamic risk taking. We think that leaves us well placed to capitalize on the opportunities ahead, as we have at many times in the past. We continue to be focused on markets and maximizing risk-adjusted returns and thank all our investors for their continued trust.
–––––––––––––––––––––––––––––––
About the authors

Mr. Govert Heijboer, Co-CIO of True Partner, has been active as a market maker trading in the European and Asian derivatives markets as well as positional trading since 2003. Govert started as a trader/researcher at Saen Options in Amsterdam and rose to become the director of derivatives trading and a member of the executive team in 2007. In 2008 he moved to Hong Kong to set up and assume responsibility for all trading activities in the new Saen Options Hong Kong branch office. Govert holds a PhD in Management Science and an MSc in Applied Physics from the University of Twente, Netherlands. He is a founding partner and has worked on the launch of the True Partner Fund since March 2010.

Mr. Tobias Hekster, Co-CIO of True Partner, has been actively trading for the past 24 years in various different roles in several markets across the globe. Starting at IMC in 1998 as a pit trader in Amsterdam, Tobias has established the off-floor arbitrage desk, headed the Chicago office in the transition from floor trading to electronic trading and set up the Asian volatility arbitrage desk in Hong Kong. Tobias holds an MSc in Economics from University of Groningen, Netherlands. Next to his role as Senior Strategist, he taught as an Adjunct Associate Professor at the Chinese University of Hong Kong and as an Adjunct Professor of Financial Practice at National Taiwan University.

Mr. Robert Kavanagh, CFA, Head of Investment Solutions of True Partner, has been in the hedge fund industry since 2004 and joined True Partner in 2019. Prior to joining True Partner he was an Executive Director at Goldman Sachs Asset Management where he spent 15 years within the Alternative Investments & Manager Selection (AIMS) group. Robert has extensive experience investing in hedge funds and working with a wide range of hedge fund investors. Robert is a CFA charterholder and holds a First Class (Honours) BSc in Philosophy and Politics from the University of Bristol, UK, where he was awarded a Social Sciences Scholarship.
–––––––––––––––––––––––––––––––
The publication of this article is available as a PDF. Download it following the link below:
Could equity volatility come from behind to win in 2023?>>
–––––––––––––––––––––––––––––––
1. Source: Boardroom website, “Saudi Arabia vs. Argentina: The Biggest Upset in World Cup History?”, 22 November 20220
2. Source: Bloomberg, as of 25 November 2022
3. The ETFs referenced are VIXY and VIXM and are referenced for illustrative purposes only.
4. Metrics shown are based on JP Morgan 95% fortnightly put selling indices. Source: Bloomberg.
5. As with any short-run measures it is important to note that these can be sensitive to the time period chosen; for example, the S&P 500 realized volatility over the period is notably influenced by the market’s reaction to the CPI; the implied volatility also includes the period over the upcoming FOMC meeting. Both of these are examples of factors we take into account when making trading decisions. However, we believe the general point above is robust to a more nuanced analysis.
6. Sources: True Partner, Robert Shiller. Provided for illustrative purposes only. No representations are made regarding index performance. Data is based on returns and earnings data sourced from Robert Shiller’s data website. Information is the latest available as of 25 November 2022.
7. For ABX pricing, see for example: bis.org
8. Attribution comments based on industry conversations and sources such as the SG Trend Indicator: societegenerale.com
- Investment Advisory in the new Space and AI age
- ”He will win who knows when to fight and when not to fight"
- Are we heading to a new ICE Age?
- AI Top or Slop: When Markets Reach Peak Magnificence
- The Hedge Fund Journal features True Partner's award-winning volatility strategies
- True Partner Fund wins award for strong performance
- True Partner releases new thought piece focused on Dutch pension funds
- True Partner Fund nominated for best performing relative value fund
- Bloomberg article highlights True Partner’s strong performance in April and year-to-date
- Bloomberg Publication: True Partner Volatility Hedge Fund Gains 5.9% During April Rout
- More news articles >
- Go to events >