December 2022, Chicago / Hong Kong
As we write, the World Cup is well underway. We have already seen some notable upsets, with the biggest arguably Saudi Arabia, ranked 51st in the world, beating Lionel Messi’s Argentina, ranked third. For football fans, the potential for such unlikely results is one of the great joys (and sorrows!) of the game. But imagine it for a moment from the perspective of odds. At the start of the game, betting odds gave Argentina an over 90% chance of winning, with just a 4% implied probability of a Saudi Arabian victory.1 Were the odds dramatically wrong? Following the matches, the odds for Saudi Arabia to win the Cup remained very long. Are sports betters and bookies slow to absorb new information? Or maybe sports fans were right in saying the long-term form books were still the most relevant factor.
2022 has seen big macro shifts
When it comes to financial markets, 2022 also has been an unusual year, with big shifts in the macroeconomic backdrop that have played out in sometimes surprising ways across markets. From a macro perspective, a few inter-related issues stand out: inflation, war, interest rates and valuations. For us, a key lens is also volatility, where we have seen sharp rises in places such as fixed income, but a surprisingly subdued reaction from equities thus far. The issues in cryptocurrency have also driven many headlines, but their impact on mainstream markets has–if anything–been less than one might have expected, despite over $2 trillion of apparent “wealth” being eradicated relative to the peak. So, a big question for investors is whether the 2022 playbook is the new normal? Or is a longer-term history still relevant?
First, let us step back a little. While we are not economists, we of course monitor macro issues as risk factors that could potentially create or limit opportunities. From early in Q4 2021, we (and several others) had been warning that inflation could be a persistent issue. This was initially due largely to pandemic-related supply constraints and stimulus-aided demand boosts, later followed by a further commodity price shock resulting from the Russian invasion of Ukraine, which looks ever more like a structural break. After more than a decade of policy makers focusing primarily on trying to generate inflation and avoid deflation, it took persistently high inflation data to create a material shift in mindset that we were back to the ‘old normal’, and a realization that inflation could become entrenched. Gradually, the word “transitory” was replaced by inflation fighting rhetoric. That shift has led to the path of tightening we are now on.
The shift in data and central bank mentalities has had major effects in fixed income markets, where a multi-decade downtrend in yields has been firmly broken and long-term bonds are nursing losses normally associated with their more volatile cousins in equity markets. As an example, TLT, a popular 20 Year + Bond ETF with over $25 billion in assets under management (AUM), is down 30% YTD as we write.2
With risk-free rates a crucial input into valuation models across asset classes this shift has been accompanied by a reconsideration of the low discount rate equity markets appeared to be applying to future earnings, the potential cost of generating growth in an environment with supply constraints and less easy money, and the realization that it may take a recession to rebalance supply and demand. This in turn had led to a decline in valuations, and particularly of the value of growth stocks whose expected earnings are further in the future and may require more financing to get there. That combination can be highly sensitive to even minor changes in the expected path.
This is most starkly seen in some of the more speculative names where investors were highly valuing growth potential and largely looking past negative cashflows. The ARK Innovation ETF is perhaps a simple illustration: after a more than 200% rise from the start of 2020 (let alone from its March 2020 lows) to early 2021, it has fallen around 80%, mostly since November 2021, and is now back roughly where it was 5 years ago. More investors have seen the loss than the gains: in 2017 the ETF had around $100-150mn in assets. At its peak it had almost $30bn in AUM.
What happened to equity volatility?
From a volatility perspective, 2022 has also been unusual. The behavior of volatility has been puzzling for many. Over the past decades, implied volatilities have consistently been negatively correlated to equity markets, with equity market declines coinciding with (sometimes sharp) increases in volatility. This dynamic makes intuitive sense from a statistical perspective, as historically, downside volatility has usually occurred in sharp bouts, whereas upside movement tends to be more gradual. From a behavioral perspective, most investors tend to have a long bias, and hold and add to positions during rising equity markets. This can result in complacency, leading investors to be caught out when the eventual down-move arrives.
Particularly since the 1987 crash, when the market fell 20% in a single day, this behavior has been somewhat anticipated by option market participants, with the volatility surface pricing a skew, whereby out-of-the-money downside options command a higher implied volatility than at-the-money or (generally) out-of-the-money upside options. However, we have seen many times that the market cannot price this perfectly, with equity market turmoil often leading to jumps in volatility and shifts in relative volatility relationships. Again, that is not a surprise: the market anticipates all sorts of behavior to different degrees – but a simple look at the fluctuations in stock prices over the past 2-3 years makes it clear that investors do not have perfect foresight.
We can separate the moves in the volatility surface into changes in generic measures, such as at-the-money volatility, which reference ever changing strikes, and changes in per-strike volatility, whereby we focus on the behavior of the implied volatility of specific options. Said another way, is the change in the generic measure (e.g. at-the-money volatility or an index like the VIX) simply driven by a move ‘along’ an unchanged volatility surface, or is the surface itself shifting? Often, we see significant moves in both aspects, as in periods like 2020. Thus far in 2022, there have been only minor changes in per-strike volatility. The movement in measures such as the VIX Index (which references an ever-evolving basket of options) has generally been movement along the surface driven by the changes in the underlying index level, rather than being driven by changes in the implied volatility of individual options themselves.
The VIX spot index is not directly tradable. VIX futures, a common expression of volatility positions, can be impacted by both aspects described above, and effectively have a measurable sensitivity (delta) to equity markets. Nevertheless, a popular short-term VIX futures ETF (which had a beta to the S&P 500 of -5 during 2021) is down almost 20% YTD through 25th November, on top of a 72% loss in 2021. A mid-term VIX futures ETF has fared better and is roughly flat for the year (after being down 17% in 2021), as longer-term implied volatilities have stayed relatively elevated. However, it would still have negative alpha for the year after accounting for its embedded beta to equities.3
We believe that observing volatilities on a per-strike basis is generally a better representation of the impact of supply and demand on implied volatilities than using generic measures. This is because excess demand for a certain option contract will have the effect of raising the implied volatility for such a contract, independent of the movement of the underlying instrument. Excess supply will have the opposite effect. As a result, shifts in per-strike volatility can also be seen as representing changes in expectations relative to what has already been priced in. Intuitively, periods of shifting expectations are more likely to generate trading opportunities.
Implied Volatilities of Selected S&P 500 options
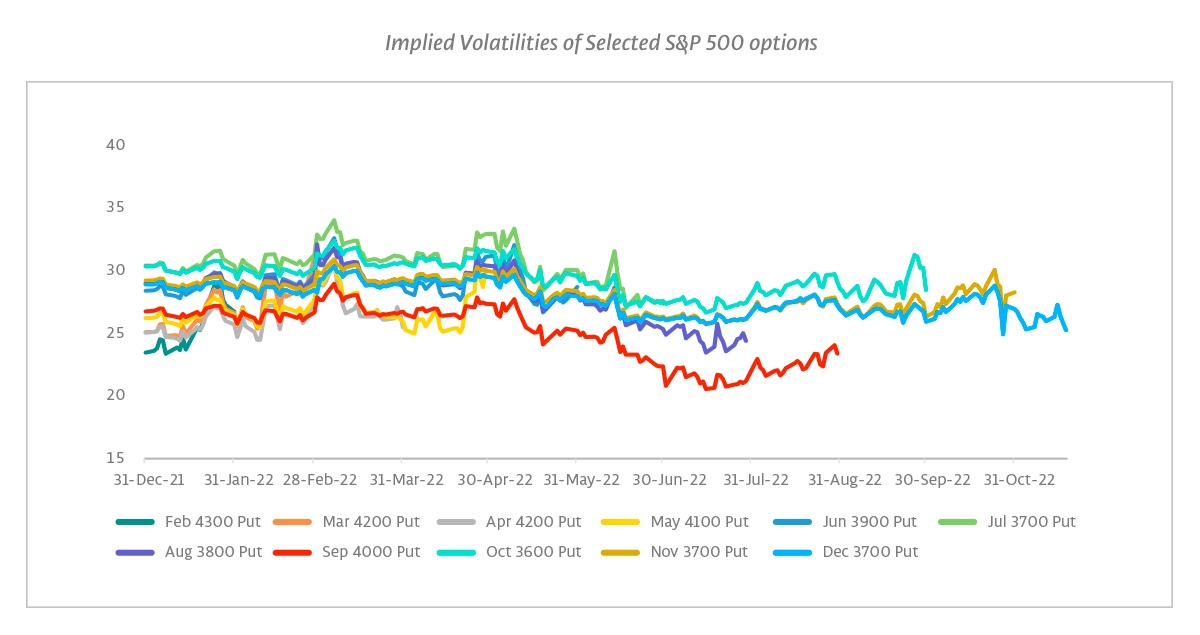
The above chart plots the volatility for the S&P 500 on a per-strike basis. Specifically, we show the implied volatility of a set of individual options on the S&P 500 through the year. To illustrate that this effect has been broad-based, we show one option for each maturity (e.g. one for February expiry, one for March expiry) and track it over time. We pick the strike based on the low of the previous month (e.g. the February strike is selected based on the market low in January). We round the strikes to the nearest 100 for simplicity and because these round numbers tend to be some of the most traded strikes. Thus, over the year this shows the implied volatility of a set of options that were at some points close to at-the-money and at other points out-of-the-money, and at different but overlapping distances to expiry. We stop each series at the month-end before expiry (thus the February expiry is shown until January month-end, the March expiry is shown until February month-end, and so on). With that long introduction, there are two obvious takeaways from the chart: 1) none of the per-strike volatilities moved very much; and 2) over the year, per-strike implied volatilities generally drifted a little lower. Notably, it is also visible that implied volatilities have been under pressure not only during the periodic recoveries but also sometimes during periods of more sizable market declines, such as in June.
Continue reading to the next page of this article >>
–––––––––––––––––––––––––––––––
The publication of this article is available as a PDF. Download it following the link below:
Could equity volatility come from behind to win in 2023?>>
–––––––––––––––––––––––––––––––
1. Source: Boardroom website, “Saudi Arabia vs. Argentina: The Biggest Upset in World Cup History?”, 22 November 20220
2. Source: Bloomberg, as of 25 November 2022
3. The ETFs referenced are VIXY and VIXM and are referenced for illustrative purposes only.
4. Metrics shown are based on JP Morgan 95% fortnightly put selling indices. Source: Bloomberg.
5. As with any short-run measures it is important to note that these can be sensitive to the time period chosen; for example, the S&P 500 realized volatility over the period is notably influenced by the market’s reaction to the CPI; the implied volatility also includes the period over the upcoming FOMC meeting. Both of these are examples of factors we take into account when making trading decisions. However, we believe the general point above is robust to a more nuanced analysis.
6. Sources: True Partner, Robert Shiller. Provided for illustrative purposes only. No representations are made regarding index performance. Data is based on returns and earnings data sourced from Robert Shiller’s data website. Information is the latest available as of 25 November 2022.
7. For ABX pricing, see for example: bis.org
8. Attribution comments based on industry conversations and sources such as the SG Trend Indicator: societegenerale.com
- Investment Advisory in the new Space and AI age
- ”He will win who knows when to fight and when not to fight"
- Are we heading to a new ICE Age?
- AI Top or Slop: When Markets Reach Peak Magnificence
- The Hedge Fund Journal features True Partner's award-winning volatility strategies
- True Partner Fund wins award for strong performance
- True Partner releases new thought piece focused on Dutch pension funds
- True Partner Fund nominated for best performing relative value fund
- Bloomberg article highlights True Partner’s strong performance in April and year-to-date
- Bloomberg Publication: True Partner Volatility Hedge Fund Gains 5.9% During April Rout
- More news articles >
- Go to events >