Page 3: Volatility update January 2021
From our perspective as equity option traders, the correlations between equities and bonds will be particularly interesting to watch as a potential catalyst. Readers will recall the “taper tantrum” of 2013, when US bond yields rose by 100bps in less than two months, while equities sold off, a period that created attractive opportunities for our strategy. The chance of a meaningful sell off in fixed income triggering a simultaneous sell off in equities seems higher than for some time.
If not fixed income, where to find diversification? Hedge funds in aggregate generally had a good 2020, but only some offered diversification in Q1. Leaving aside for a moment our own funds (which did well), the speed of the change in markets in 2020 benefited certain tail risk strategies (also 2008 winners) that had been long far out of the money options. We give due credit to those macro managers who correctly anticipated the rapid Fed response. Perhaps they can identify the policy toolkit for next time too. On the other hand, the moves caught out some strategies that had been good diversifiers in 2008, such as some longer-term trend followers. Alternative risk premia generally behaved like risk premia, rather than diversifiers. Bitcoin, sometimes now touted as a hedge, was down 35% in Q1. Investors may wish to consider a portfolio approach, with different kinds of tools. With increased central bank intervention in markets, we believe it is important to think about which markets can move, and how quickly to take profits. Post financial crisis reforms helped reduce stress in money markets vs. the 2008 experience. What is still free to move in the next crisis?
Equity volatility remains highly sensitive to risk sentiment
Thinking about our own opportunity set, equity volatility is one of the few “risk off” barometers that exceeded 2008 levels in 2020, with the rapid changes in markets leading to a spike in the VIX slightly beyond that seen after the collapse of Lehman, albeit the reversal was also faster. Equities, being at the bottom of the capital structure, are leveraged to marginal perceptions of change, and remain one of the last places policymakers intervene. It seems to us that equities are perhaps the markets most “free” to express changes in risk sentiment where large numbers of market participants can trade in large size. In short, in a macro shock, equity products remain the fastest and easiest way to adjust risk.
Equity Implied Volatility during the Equity Drawdown10
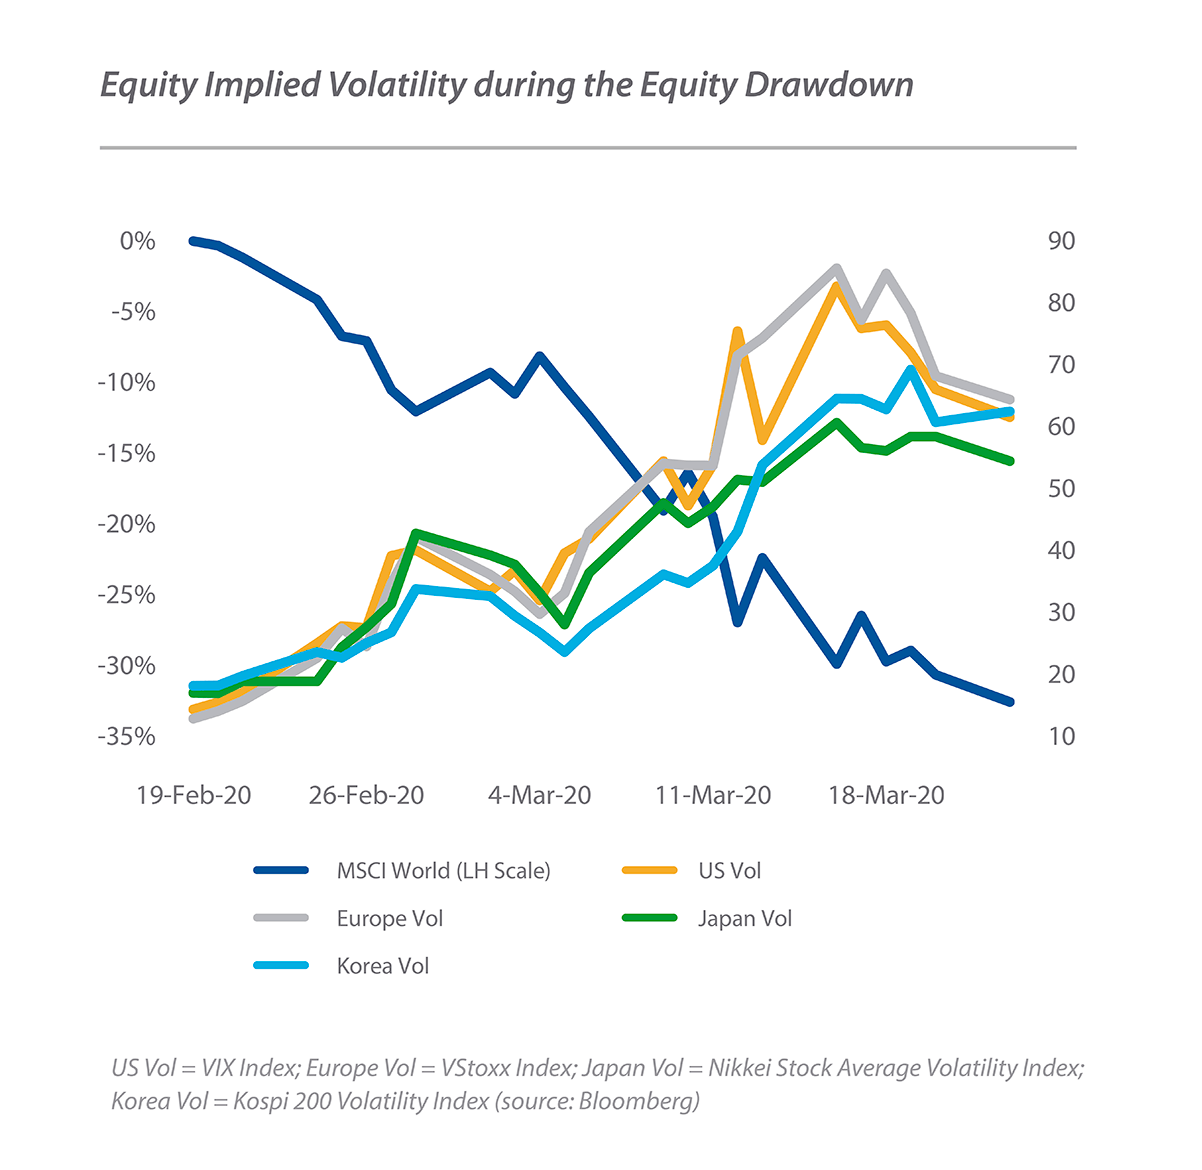
Q1 policy interventions were bigger and faster than in 2008, leading markets to turn positive more quickly, but in the moment equity volatility offered attractive diversification opportunities. That led to profits for tail risk managers and attractive relative value opportunities for our strategies. We were particularly pleased that our funds were able to monetise gains quickly and delivered positive returns in not only the worst week for the S&P 500 (the week ending 20th March, which was our best week of 2020) but also (in smaller size) during the rebound the following week.
If asset allocators do substitute liquid government bonds for less liquid corporate or private credit, and perhaps some public equity for private equity, that will leave public equities as even more the liquid asset in which portfolio risk changes can most easily and quickly be effected. In March, the large discounts to NAV for some corporate credit ETFs suggested that equity markets are now even being used to adjust exposures in non-equity asset classes (as some policymakers have also noted). The discounts to NAV are also a reminder of the clearing prices of credit during periods when cash instruments are seeing little volume, and prices can seem steady but are not always tradable. We think that means equity volatility will continue to be vulnerable to spikes on surprises in newsflow and changes in positioning. Perhaps more so. Market microstructure effects remain. That should lead to continued attractive relative value opportunities in risk-off periods and leaves us confident in our own continued opportunity set in such periods of stress.
But what of higher implied volatility levels? Implied volatility has retreated significantly since March, to such an extent that even if you had managed to go long the VIX ETF in late February – i.e. before the main part of the equity sell off – you would have been down substantially through end-2020. However, volatility remains above end- 2019 levels.
30-Day Implied Volatility vs Long-Term Average (2006 to present)11
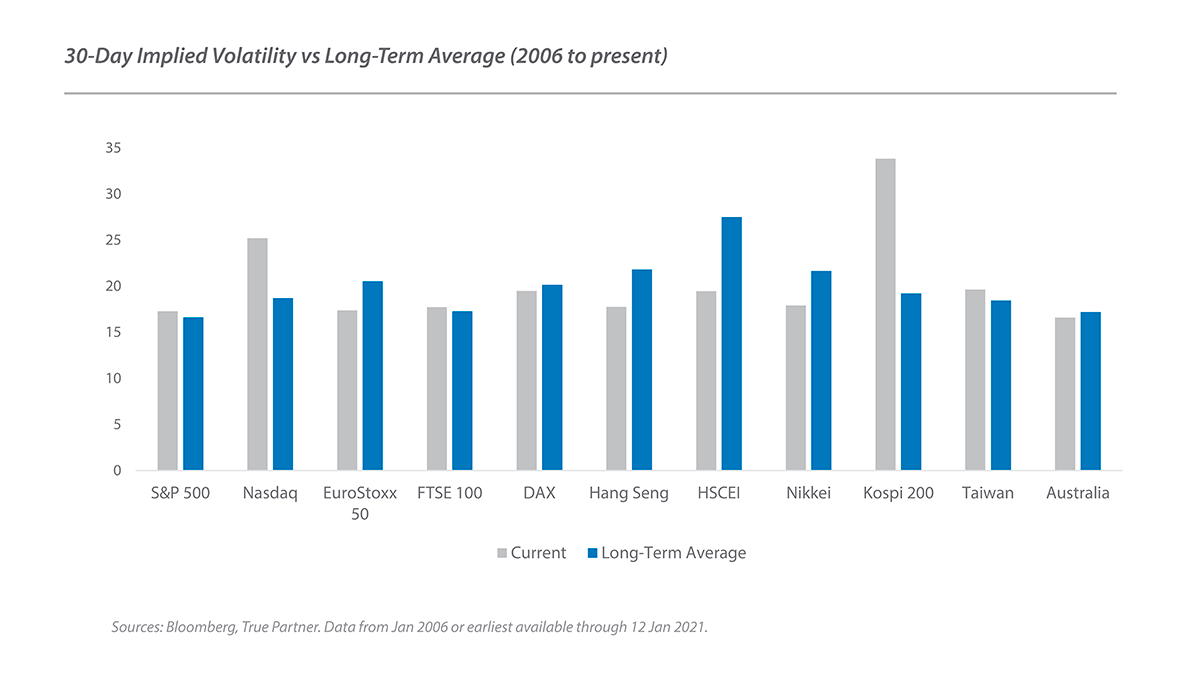
As we pointed out in our letter in January 2020, end-2019 levels were unusually low. Volatility generally remains below end-2018 levels, and substantially below in some markets. Current levels of 30-day implied volatility are closer to longer-term averages, with some dispersion across markets. A number of indices have implied volatility below long-term average (and median) levels, while others are higher. The spikes of 2020 are a reminder as to why there is typically a premium for implied volatility over realised volatility. As with levels of volatility, there is dispersion in premia too. Net, implied volatility is not necessarily “expensive”, though also not necessarily “cheap”. As always, looking across markets tells a more nuanced picture than the VIX.
If hopes are realised, vaccines will be rolled out smoothly, the virus will recede, jobs will return and the economy will recover, fast enough to pay back all the 2020 borrowing and deliver EPS growth, but not so fast as to create inflation concerns and higher borrowing costs. In that Goldilocks scenario, markets could drift higher, realised volatility may drift lower and implied volatility will likely follow at a lag. That could be a good environment for our short book, but one that may be more challenging for our longs. It could be difficult for an outright long volatility bias, though this can still offer a useful portfolio function.
Clearly, many things could also upset this picture. Most worryingly, perhaps a Covid mutation will occur that resists the vaccines, or simply one that is missed until it has spread globally. If the UK variant had emerged elsewhere, would it have been caught and travel restricted in time? Maybe markets start to worry more about debt levels for companies whose assets are lying idle, credit spreads widen and more bankruptcies occur. Maybe offices and bricks and mortar retail are permanently impaired, along with the “safe” credit instruments dependent on their rents. Perhaps climate change will result in a new property driven financial crisis, as a Harvard Business School lecturer recent argued.12 Most simply, loss of momentum and a shift in sentiment could see exuberance in certain markets reverse, triggering broader position unwinds as speculators face margin calls. With recent exuberance about crypto-assets, a sustained reversal there may have wider implications for positioning than in the past. As discussed above, we believe the increased interdependence of fixed income and equities could exacerbate any shocks.
Perhaps most likely, markets at different times face slightly different versions of these stories and ones in between, with new events that are currently off the radar. That will create both long and short opportunities, in volatility and in other strategies. We are thus happy to have a relative value approach, and to be conscious of net vega and theta exposures, as we strive to achieve a mix of Q1 and Q2 returns and avoid the partial giveback of gains we saw in the latter half of 2020.
We would be surprised if even relatively smooth sailing is not punctuated by occasional volatility spikes, as these are a typical feature of even bull markets, and have generated much of our returns during the last decade – a period when equities have, from a long-run perspective, delivered substantially above-average returns. As we look forward, we are therefore optimistic regarding the opportunity set, and our ability to deliver for our investors. We wish to thank all our clients for their continued support and look forward to our continued partnership with you in the year ahead.
–––––––––––––––––––––––––––––––
About the authors

Mr. Govert Heijboer, Co- CIO of True Partner, has been active as a market maker trading in the European and Asian derivatives markets as well as positional trading since 2003. Govert started as a trader/ researcher at Saen Options in Amsterdam and rose to become the director of derivatives trading and a member of the executive team in 2007. In 2008 he moved to Hong Kong to set up and assume responsibility for all trading activities in the new Saen Options Hong Kong branch office. Govert holds a PhD in Management Science and an MSc in Applied Physics from the University of Twente, Netherlands. He is a founding partner and has worked on the launch of the True Partner Fund since March 2010.

Mr. Tobias Hekster, Co- CIO of True Partner, has been actively trading for the past 21 years in various different roles in several markets across the globe. Starting at IMC in 1998 as a pit trader in Amsterdam, Tobias has established the off-floor arbitrage desk, headed the Chicago office in the transition from floor trading to electronic trading and set up the Asian volatility arbitrage desk in Hong Kong. Tobias holds an MSc in Economics from University of Groningen, Netherlands. Next to his role as Senior Strategist, he taught as an Adjunct Associate Professor at the Chinese University of Hong Kong and as an Adjunct Professor of Financial Practice at National Taiwan University.

Mr. Robert Kavanagh, CFA, Head of Investment Solutions of True Partner, has been in the hedge fund industry since 2004 and joined True Partner in 2019. Prior to joining True Partner he was an Executive Director at Goldman Sachs Asset Management where he spent 15 years within the Alternative Investments & Manager Selection (AIMS) group. Robert has extensive experience investing in hedge funds and working with a wide range of hedge fund investors. Robert is a CFA charterholder and holds a First Class (Honours) BSc in Philosophy and Politics from the University of Bristol, UK, where he was awarded a Social Sciences Scholarship.
–––––––––––––––––––––––––––––––
The full publication of this article is available as a PDF. Download it following the link below:
January 2021 Volatility Update >>
–––––––––––––––––––––––––––––––
1. Throughout this document, MSCI World refers to the MSCI World Total Return Hedged to US Dollars (source: Bloomberg).
2. “A World at Risk: annual report on global preparedness for health emergencies”, World Health Organisation Global Preparedness Monitoring Board, September 2019 apps.who.int. The report warns of the theoretical risks of “high-impact respiratory pathogens… spread by respiratory droplets… [and which can] move rapidly across multiple geographies”
3. See gmo.com
4. See microstrategy.com
5. Indeed, we note that one well respected asset manager has recently launched a product based on the prediction of a TMT unwind similar to that seen from 2000-02
6. “Distress looms over U.S. commercial real estate in 2021”, Marketwatch, 13 December 2020; marketwatch.com;
7. “Billionaires’ Row Condo Records 51% Resale Loss in Luxury Glut”, Bloomberg, January 8, 2021 bloomberg.com;
“Ho, ho — oh, no! Values of troubled Manhattan retail properties sink 53%”, Marketwatch, December 8, 2020; marketwatch.com
8. Avalos, Fernando and Xia, Dora, “US Treasuries and equity sell-offs: is the hedge faltering?”, BIS Quarterly Review, 7 December 2020
9. Indices used are the Bloomberg Barclays US Government Inflation-Linked All Maturities Total Return Index and the Bloomberg Barclays Global Inflation Linked Index Hedged USD and its unhedged equivalent. Source: Bloomberg
10. US Vol = VIX Index; Europe Vol = VStoxx Index; Japan Vol = Nikkei Stock Average
Volatility Index; Korea Vol = Kospi 200 Volatility Index (source: Bloomberg)
11. Sources: Bloomberg, True Partner. Data from Jan 2006 or earliest available through 12 Jan 2021.
12. “Are we on the verge of another financial crisis?” Harvard Business Review, 18 December 2020 hbr.org
- Investment Advisory in the new Space and AI age
- ”He will win who knows when to fight and when not to fight"
- Are we heading to a new ICE Age?
- AI Top or Slop: When Markets Reach Peak Magnificence
- The Hedge Fund Journal features True Partner's award-winning volatility strategies
- True Partner Fund wins award for strong performance
- True Partner releases new thought piece focused on Dutch pension funds
- True Partner Fund nominated for best performing relative value fund
- Bloomberg article highlights True Partner’s strong performance in April and year-to-date
- Bloomberg Publication: True Partner Volatility Hedge Fund Gains 5.9% During April Rout
- More news articles >
- Go to events >