Global Asset Management

True Partner article: The future ain’t what it used to be... observations on an uncertain world

Page 2: Volatility update January 2021

Echoes of 1999?

Perhaps inevitably given the size of stimulus in 2020, some excess liquidity seems to have found its way into risk asset prices – indeed this is one of the intentions of QE, through “wealth effects” and the “portfolio rebalancing” channel. However, there are signs of over-exuberance, with recent months having seen turbo-charged gains in some areas. It is hard to explain the fundamentals behind the ~300% rise in Bitcoin since September (an additional $500 billion in market cap and a 4x rise vs gold) and the doubling of Tesla since mid-November (an additional $400 billion in market cap). MicroStrategy issuing convertible bonds at a sub-1% yield to make a leveraged Bitcoin investment is another harbinger of the times.4 The over 240 SPAC IPOs in 2020 offer a pointed reminder of the pre-2008 vintage of SPACs which, euphemistically speaking, did not end well. At the same time, FOMO (Fear Of Missing Out) is undoubtedly pressuring sceptics to get on board the “this time it’s different” bandwagon.

As others have noted, it is hard not to be reminded of the exuberance of 1999 and early 2000.5 As then, we are seeing high retail participation and new technologies making it easier and cheaper for small investors to trade. That era is often remembered as one in which companies with no realistic business model were overvalued by retail hype. Clearly, there were some IPOs with shall we say “optimistic” business models (readers may remember Pets.com, which went bust within 12 months of its successful IPO…) But a large part of the boom was over-excitement about fundamentally good companies that were just bid up way too high. To give an example, in late 1999/early 2000, Cisco doubled in value, adding $300bn in market cap in four months as markets anticipated future brilliance. Since then Cisco has had a 4-fold increase in revenues and a 5-fold increase in profits (more than 2x faster growth than US GDP for 20 years) – a huge fundamental success. But markets had priced in even more. Cisco stock fell 90% from its peak and its share price has still not recovered its March 2000 levels.

At the same time as this exuberance, occasional headlines remind that not everything is going up. Signs of distress are rising in commercial real estate6, while it was recently noted that some luxury apartments and retail properties in Manhattan have been valued at only half their value just a few years ago.7 After the 2008 crisis and the sharp market recovery of 2009, European periphery debt problems became a major focus in 2010. Will some of the underlying issues remaining from the Covid-crisis escalate over the next 1-2 years?

But will risk assets broadly reverse soon? From a cyclical perspective, once vaccines are rolled out, economic activity will surely increase, and jobs in affected sectors will start to come back. With savings high amongst the better-off, as and when economies reopen, there would seem to be ample room for higher consumer spending, which some analysts expect to drive a rise in meaningful rise in inflation. Central banks may ignore that and keep short-term rates low, allowing yield curves to steepen, and we have already seen a rise in breakeven inflation rates. Higher growth usually is good for markets and so many strategists are advocating holding on. With many equity markets higher than pre-Covid-19 levels, a large part of the recovery must be priced in – but how much?

The pace of reopening could yet disappoint. Social distancing and other protective measures may also need to remain for some time, limiting capacity levels. Thus far, vaccine roll outs are also taking longer than hoped as the logistical challenge of rapidly producing and delivering millions upon millions of doses proves as difficult as one might think. For all the economic benefits of the policy support in 2020, much has been based on loans, not grants. For many companies, Covid-19 has simply meant productive assets lying idle, saved from bankruptcy by increased borrowing. Repaying borrowing will be a drag on future earnings and some companies may learn the hard way there is a difference between liquidity and solvency.

Worryingly, Covid-19 itself seems to be trying to outpace the amazing speed of human ingenuity in virus fighting. Recent mutations have resulted in much more infectious strains that are pushing healthcare systems in some countries to their limits. While the UK has so far been the worst hit by this, it is of note that the UK is also one of very few countries that routinely screens test results to identify such mutations. If mutations occur elsewhere, they may not be identified so quickly. More infectious strains require a faster response to be contained. Indeed, Brisbane recently announced a lockdown on the back of a single case of this new variant. The need to react in such ways means the cost of containment could remain high. Net, there are various ways the pace of the return to normal could be disappointing slow.

Diversification is harder to find

Ultimately, with cash yields generally zero or negative, investors have to buy something. As another acronym claims, “There Is No Alternative” (to equities). Returning to the asset allocation dilemma, ultra-low government bond yields mean lower expected portfolio returns for many and a less well hedged portfolio. That means there is pressure to take more risk elsewhere, at the same time as there is less room to do so.

Equities and Bonds during the Equity Drawdown

Equities and Bonds during the Equity Drawdown

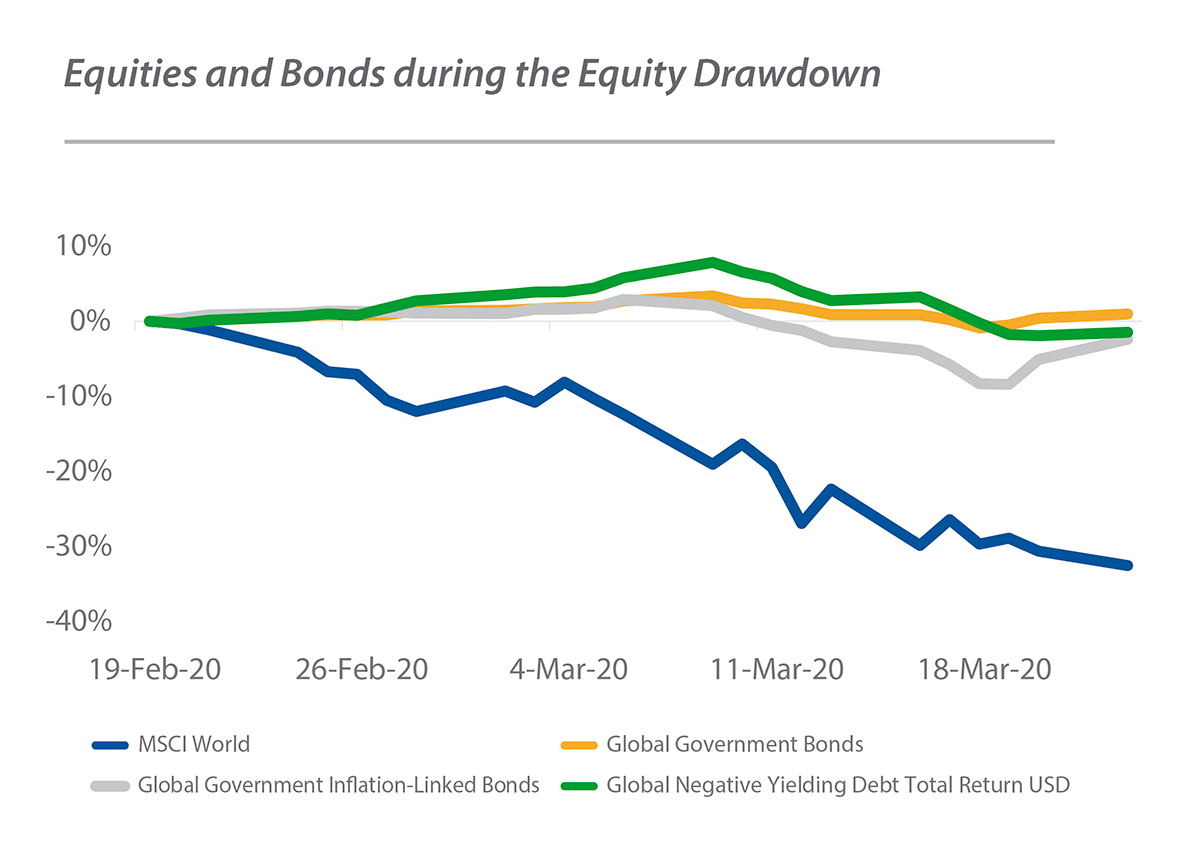
One popular answer to this seems to be to reduce government bonds, hold on to risk assets, take more liquidity risk, and look for diversification elsewhere. While there are arguments both ways, it’s easy to see the case for reducing government bonds. Many such bonds offer negative yields and did little in Q1. Indeed, being long Japanese, German or Swiss bonds – places where rates were already negative entering the sell-off– lost money in March. Negative carry and no diversification is a difficult mix.

Even long-term US Treasuries, which had strong returns in Q1 overall, were a somewhat unreliable hedge in the heat of the equity sell-off, impacted by heavy positioning which caused significant volatility. Taking the TLT ETF (which holds 20y+ Treasuries) as a proxy, long-term US Treasuries were down slightly from 19th Feb (the peak of the S&P 500) through 18th March – a period over which the S&P 500 was down 29% and the Fed had already cut rates dramatically. That’s not usually the kind of behavior one expects from a hedging asset.

Will Treasury yields go lower in a big risk off move? Probably. But it will be hard to repeat the returns of Q1. The Fed has been pretty clear it doesn’t like the idea of negative rates and a flat yield curve causes problems for the banking system, which profits from borrowing short and lending long. Policymakers seem likely to try to find different tools. Researchers at the BIS recently noted that the diversification benefits of Treasuries had already been declining for some time. It’s also worth recalling, as the BIS highlighted, that the negative equity/bond correlation markets have become used to is not a fixed phenomenon: looking over the long-term, equities and bonds have had long periods of positive correlations in the past.8

Moves in recent months also highlight the risk of capital loss in bonds. Following Biden’s election win and the narrowly Democratic Senate, the US 10-year yield has decisively cleared the 1% mark. With the Fed committed to making up for past under-inflation to achieve its “average” target level, that means targeting above 2% inflation for some period. So we could see heavy borrowing, a dovish Fed and rising inflation all at the same time. Already in 2020 some in Europe were arguing for central banks to simply write off government bonds, effectively directly printing to finance spending. Net, there are various reasons a negative real yield doesn’t seem particularly attractive.

Inflation-linked bonds are not a panacea either as inflation expectations tend to drop during major risk off moves. Looking from the peak to the trough of the S&P 500 drawdown in Q1, US inflation linked government bonds had a marginally negative total return. The global equivalent index was down -2.4%, or -6.5% without a USD hedge. Inflation linked bonds were also losers during the worst parts of the 2008 crash.9

Continue reading to the next page of this article >>

–––––––––––––––––––––––––––––––

The full publication of this article is available as a PDF. Download it following the link below:
January 2021 Volatility Update >>

–––––––––––––––––––––––––––––––

1. Throughout this document, MSCI World refers to the MSCI World Total Return Hedged to US Dollars (source: Bloomberg).
2. “A World at Risk: annual report on global preparedness for health emergencies”, World Health Organisation Global Preparedness Monitoring Board, September 2019 apps.who.int. The report warns of the theoretical risks of “high-impact respiratory pathogens… spread by respiratory droplets… [and which can] move rapidly across multiple geographies”
3. See gmo.com
4. See microstrategy.com
5. Indeed, we note that one well respected asset manager has recently launched a product based on the prediction of a TMT unwind similar to that seen from 2000-02
6. “Distress looms over U.S. commercial real estate in 2021”, Marketwatch, 13 December 2020; marketwatch.com;
7. “Billionaires’ Row Condo Records 51% Resale Loss in Luxury Glut”, Bloomberg, January 8, 2021 bloomberg.com;
“Ho, ho — oh, no! Values of troubled Manhattan retail properties sink 53%”, Marketwatch, December 8, 2020; marketwatch.com
8. Avalos, Fernando and Xia, Dora, “US Treasuries and equity sell-offs: is the hedge faltering?”, BIS Quarterly Review, 7 December 2020
9. Indices used are the Bloomberg Barclays US Government Inflation-Linked All Maturities Total Return Index and the Bloomberg Barclays Global Inflation Linked Index Hedged USD and its unhedged equivalent. Source: Bloomberg
10. US Vol = VIX Index; Europe Vol = VStoxx Index; Japan Vol = Nikkei Stock Average
Volatility Index; Korea Vol = Kospi 200 Volatility Index (source: Bloomberg)
11. Sources: Bloomberg, True Partner. Data from Jan 2006 or earliest available through 12 Jan 2021.
12. “Are we on the verge of another financial crisis?” Harvard Business Review, 18 December 2020 hbr.org

Latest news articles

Website Privacy Statement and Disclaimer for Fund

Privacy Statement

True Partner respects your privacy. This Privacy Statement describes the types of personal information we collect on the website, how we may use the information, the purposes for which we may use it, and with whom we may share it.

By visiting or submitting information to this website, you are accepting and consenting to the provisions set forth in this privacy statement. If you do not agree to this privacy statement, please do not use this website.

True Partner may obtain personal information through this website, including when you send us a contact message which includes your name, e-mail address, telephone number, and any other information you provide in the message box.

During your use of this website, technical and usage data pertaining to your device and/or Internet connection is collected, including your Internet browser type, your preferences on this website, your IP address and other of your device characteristics. This is undertaken in order to manage best website experience and enhance the safety and security of the website. This technical and usage data is obtained using "cookies" or other similar technologies. In compliance with relevant law, we may retain information as needed or appropriate to serve our legitimate business purposes or as required by law.

True Partner will not sell or rent your personal information to anyone. Your personal information (e.g., IP address) will be available to our technical service providers who are administering and storing our website data. They are not authorized to use or disclose your personal information except as necessary to perform services on our behalf or comply with legal requirements.

True Partner maintains safeguards designed to protect personal information from loss, misuse, and unauthorized access, disclosure, alteration, and destruction.

This website may contain links to other websites for your convenience and information. Linked websites may have their own privacy policies or notices, which we suggest you review if you visit any linked websites. We are not responsible for the content of any websites, any use of those websites, or the privacy practices of those websites.

Additional information regarding our personal data processing purposes and the rights of those natural persons whose personal data we process can be found in our additional General Privacy Statement (pdf file).

Please contact us at phone number +1 312 675 6126 if you have any questions about this privacy statement or the personal data we hold about you.


Disclaimer
All information contained on this website is for informational purposes only. This information is not in any way intended to solicit investment. It is important that you do not use this website to request, authorize or affect the purchase or sale of any security, to send fund transfer instructions, to affect any other transactions or to send time sensitive instructions. Nothing in this information constitutes investment, legal, accounting or tax advice, or a representation that any investment or strategy is suitable or appropriate for your individual circumstances. Any discussions of past performance should not be taken as an indication of future results, and no representation, expressed or implied, is made regarding future results. You should consider the specific return and risk profile of any investment or strategy before effecting, or agreeing to effect, any transaction.

Fund Disclaimer
This document has been prepared and issued by True Partner Advisor (“True Partner”). This presentation is confidential, is intended only for the person to whom it has been provided and under no circumstance may a copy be shown, copied, transmitted, or otherwise given to any person other than the authorized recipient without the prior written consent of True Partner. Notwithstanding the foregoing, an investor may disclose to any and all persons, without limitation of any kind, the tax treatments and tax structure of True Partner Fund, (the “Fund” or “Offering”) and all materials of any kind, including opinions or other tax analyses that are provided to the investor relating to such tax treatment and tax structure. The distribution of the information contained herein in certain jurisdictions may be restricted, and, accordingly, it is the responsibility of any prospective investor to satisfy itself as to compliance with relevant laws and regulations.

Nothing herein constitutes an offer to sell, or solicitation of an offer to purchase, any securities, nor does it constitute an endorsement with respect to any investment strategy or vehicle. Any offer of securities may be made only by means of a Confidential Memorandum (the “Memorandum”), which contains additional information about the Fund and expenses associated with an investment therein, only to sophisticated investors in jurisdictions where permitted by law. All relevant Offering Documents should be carefully reviewed before investing. Any decision to invest in the Fund should be based solely on the information included in the Memorandum. In the case of any inconsistency between the descriptions or terms in this presentation and the Memorandum, the Memorandum shall control.

Past performance is not indicative of future results. The information contained herein is preliminary, is provided for discussion purposes only as a summary of key information, is not complete and does not contain certain material information about the Offering. The information contained herein does not take into account any particular investment objectives or financial circumstances of any specific person who may receive it. Parties should independently investigate any investment strategy or manager, and should consult their own advisors as to legal, tax, accounting, regulatory and related matters prior to investing. These materials may contain historical market data; however, historical market trends are not reliable indicators of future market behavior. Due to, among other things, the volatile nature of the markets and the investment strategies discussed herein, the investment strategies may only be suitable for certain investors. There can be no assurance that the Offering will have a return on capital similar to historical returns provided because, among other reasons, there may be differences in economic conditions, regulatory climate, portfolio size, leverage use, expenses and structure, as well as investment policies and techniques. Any information provided with respect to how the portfolio will be constructed is merely a guideline, which True Partner may change at any time in its sole discretion. Unless otherwise indicated, the information contained herein is believed to be accurate as of the date indicated. No representation or warranty is made as to its continued accuracy after such date.

The Fund is not registered under the Investment Company Act of 1940, as amended, in reliance on an exception thereunder. Interests in the Fund has not been registered under the Securities Act of 1933, as amended, or the securities laws of any state; they are being offered and sold in reliance on exemptions from the registration requirements of said Act and laws. Neither the Fund’s Operative Documents, nor the offering of its limited partnership interests, have been reviewed or approved by U.S. federal or state regulators. Interests in the Offering are not deposits or obligations of, or guaranteed or endorsed by, any bank or other insured depository institution, and are not federally insured by the Federal Deposit Insurance Corporation, The Federal Reserve Board or any other governmental agency. The interests issued by the Fund are offered or otherwise made available only in accordance with available, applicable private placement or offering rules.

An investment in the Offering is illiquid and there are significant restrictions on transferring the Funds’ limited partnership interests. There are no secondary markets for the Fund’s limited partnership interests and none are expected to develop. True Partner has sole discretion regarding the allocation of the Fund assets. The Fund represents a speculative investment and involves a high degree of risk. The Fund’s portfolio, which is under the sole trading authority of True Partner, is principally an Equity Volatility Arbitrage fund. This lack of diversification may result in higher risk.

A private fund is generally not subject to the same regulatory oversight and/or regulatory requirements as a mutual fund. The Offering is not required to provide periodic pricing or valuation information to investors. Investments may involve complex tax structures resulting in delays in distributing important tax information.

Certain instruments may have no readily available market or third party pricing. Performance may be volatile as private funds may employ leverage and other speculative investment practices that may increase the risk of investment loss, and adherence to risk control mechanisms does not guarantee investment returns. Additionally, fees may offset an investor’s profits. A comprehensive list of potential risk factors is outlined in the Offering Documents.

Investing in the financial markets involves a substantial degree of risk. There can be no assurance that the investment objectives described herein will be achieved. Investment losses may occur, and investors could lose some or all of their investment and successfully overcoming barriers to entry, e.g., legal and regulatory enterprise does not guarantee successful investment performance. No guarantee or representation is made that the Fund’s investment program, including, without limitation, its investment objectives, strategies or risk monitoring goals, will be successful and investment results may vary substantially over time. Investment losses may occur from time to time. Nothing herein is intended to imply that the Fund’s investment methodology should be considered “conservative”, “safe”, “risk free” or “risk averse.” An investment in any fund should be discretionary capital set aside strictly for speculative purposes.

Certain information contained in this document contains: forward-looking statements” which can be identified by the use of forward-looking terminology such as “may”, “will”, “should”, “expect”, “anticipate”, “target”, “project”, “estimate”, “intend”, “continue” or “believe” or the negatives thereof or other variations thereon or comparable terminology. Due to various risks and uncertainties, actual events or results or the performance of the Fund may differ materially from those reflected or contemplated in such forward-looking statements. Forward looking information is subject to inherent uncertainties and qualifications and could be based on numerous assumptions. Forward looking information is provided for illustrative purposes only and is not intended to serve as, and must not be relied upon by any investor as, a guarantee, an assurance, a prediction or a definitive statement of fact or probability.

Performance Methodology: Past performance is not an indicator of future performance. Annualized Returns or Performance figures for True Partner Fund are based on Class B shares and are shown on a net basis after the deduction of a 2% management fees and a 20% performance fee, trading related and other expenses that an investor would have or actually paid.

The indexes’ performances do not reflect the deduction of transaction costs, management fees, or other costs which would reduce returns. References to market or composite indexes, benchmarks or other measures of relative market performance (indexes) over a specified period of time are provided for your information only and do not imply that a portfolio will achieve similar returns, volatility or other results. The composition of an index may not reflect the manner in which a portfolio is constructed in relation to expected or achieved returns, portfolio guidelines, restrictions, sectors, correlations, concentrations, volatility or tracking error targets, all of which may change over time. Indexes are used as performance benchmarks only, as True Partner does not attempt to replicate an index. The composition of the indexes is not necessarily similar to accounts managed by True Partner. The prior performance of the indexes will not be predictive of the future performance of accounts managed by True Partner. An investor may not invest directly in an index.