
June 2023, Chicago/Hong Kong
Despite the headwinds of continued rate hikes and growing recession fears, equity markets have risen strongly in 2023 year to date. At the same time, implied volatility has compressed to levels well below long-term averages in major indices such as the S&P 500 and the Euro Stoxx 50. In this article, we assess the rally, what may be coming next and how investors can position for different scenarios.
Since our volatility update last month (“Don’t Look Down”), the political theatrics of the US Debt Ceiling increase have resulted in a compromise which avoided a potentially catastrophic default. As we have discussed in previous commentaries, US Treasuries and sovereign CDS had been pricing in an unusually high risk of default, while equity markets were relatively unfazed. Nevertheless, the resolution of the issue triggered yet another leg in the equity market rally, extending further the gains which initially took off last year from the troughs of September.
Perhaps more surprising than ultimately staving off a US default is the magnitude of this continuing rally. As we write the S&P 500 and Nasdaq 100 are each up over 5% MTD; the Nasdaq 100 is up a whopping +38.5% YTD1, while the S&P 500 is up +15.8%. For the S&P 500, the rally YTD also follows a strong Q4 gain (while the Nasdaq was flat in Q4): since month-end September 2022, the S&P 500 has gained around +24.5%, whereas the Nasdaq 100 has risen +38.4%. In Europe, the Euro Stoxx 50 is up +18% YTD and +35% since the end of September 2022. Markets have been able to notch these gains in spite of interest rates picking up, as the idea of rates needing to be ‘higher for longer’ becomes more widely accepted. The implied Fed Funds rate for December 2023 has risen from 4.3% at the end of September 2022 to 5.2% as of 16 June 2023. There is an old market adage that markets go up on an escalator (i.e. steadily) and down in an elevator (i.e. quickly). The recent rally in some areas has been almost an elevator up. Is this set to persist or could we be near the top?
There are signs that all is not well even within the rally. As JP Morgan strategists recently commented, the market gains have been quite narrowly based: as per month-end May, the average YTD return on Amazon, Apple, Alphabet (Google), Meta (Facebook), Microsoft, NVIDIA and Tesla was +84%, whereas the average YTD return for the rest of the S&P 500 was +3.7%2. And that was prior to the current bull run in June where again these mega-caps have been the main drivers. Indeed, until it joined in the June rally, the small-cap focused Russell 2000, perhaps a better indicator of companies focused on the US domestic economy, was around flat YTD.
Interestingly, apart from the Debt Ceiling which has been resolved, the other potential market headwinds remain in place. The conflict in Ukraine has intensified after being more or less frozen for the past half year with the widely expected Ukrainian offensive kicking in high gear against the backdrop of the human, economic and ecological disaster of the collapse of the Kakhovka dam, with its associated implications for food production. Looking towards the Pacific, tensions between the United States and China remain, and the trend of reshoring / de-globalization is continuing, which we believe could be a long-term inflationary headwind by reducing trade. Two other main discussion topics over the past year, the persistent inflation on one hand, and the fear of a recession on the other, continue to be relevant.
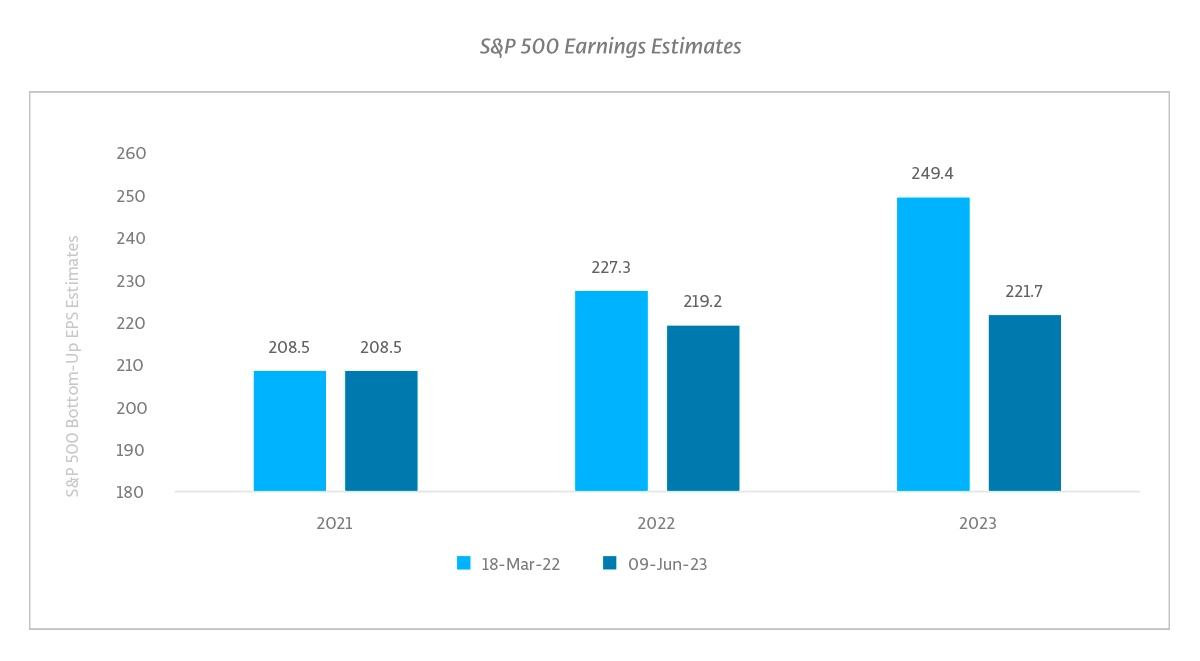
The Federal Reserve’s aggressive tightening cycle, which was the most aggressive in decades with 11 hikes in 15 months for a total increase in the Fed Funds rate of 500 basis points, could logically be expected to have an impact on the economy. Still, the stock market trades at roughly the same level as when the Fed embarked on this cycle in March 20223 and the labor market has remained remarkably resilient. However, elsewhere cracks have clearly started to show. Estimated earnings for 2023 have fallen by over 10% since March 2022. Furthermore, current estimated earnings for 2023 are still shy of what was expected for calendar year 2022 back at the time of the first hike in March 2022.4
S&P 500 Earnings Estimates
The mini-banking crisis in March was a direct consequence of higher rates impacting the assumptions behind much lending and market behavior in the last 10 years, with previously big players in lending seeing their risk assumptions proved wrong. This is a potential threat to the viability of all but the largest, most well capitalized US banks. And higher rates are also adding stress to (commercial) real-estate markets, already gutted by the Covid pandemic and continuing remote working arrangements. In several major US metropolitan areas, from shopping malls to skyscrapers owners have walked away from their distressed properties, relinquishing ownership to banks and bond holders. San Francisco is a particularly acute example of this. This suggests lending standards will continue to tighten, restricting flow of credit.
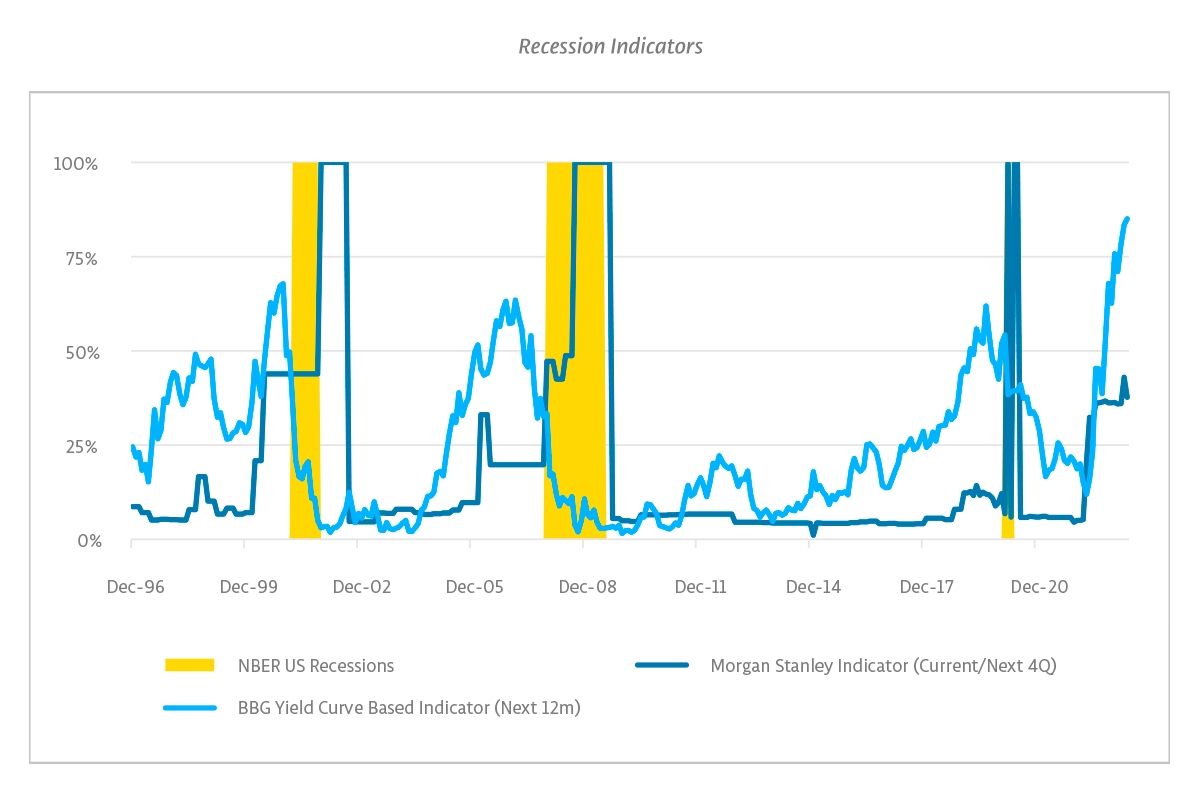
But besides the value destruction in specific sectors such as real estate, the overall economic momentum continues to be deteriorating, as the impact of higher interest rates and tightening credit conditions makes its way through the economy. Several recession indicator models are now pointing to heightened recession risks in the near-term, as shown in the chart below, including perhaps the most famous, based on the spread between short-term and long-term US government bond yields.
Recession Indicators5
But while curtailing inflation appears to have come at a cost, equity markets appear to be prematurely declaring victory on inflation. While inflation measures have notably cooled from their earlier peaks, real rates remain negative across a swath of countries and are still barely positive in the US, following the Fed’s aggressive tightening cycle.
And some of the favorable trends driving the easing of inflation may cease or even reverse. After continuous declines from their peaks last Autumn, natural gas prices have recently jumped highlighting increased global demand now that Chinese demand has picked up. European prices have particularly spiked, exposing the risk of dependence on Norway as the de-facto only supplier of energy. Food prices look to be rising going forward as well. Not only will the tragic dam collapse in Ukraine diminish its role as the world’s breadbasket, but the US Climate Prediction Center just confirmed the return of El Nino (and at that, a potentially strong occurrence thereof). This weather pattern, last experienced in 2019, has an unfavorable effect on various crops and is thus expected to add to inflation globally. Logistical bottlenecks, the same culprit for what was initially perceived as temporary inflation, are popping up with continued threat of strike action in America’s ports and load restrictions for the Panama Channel.
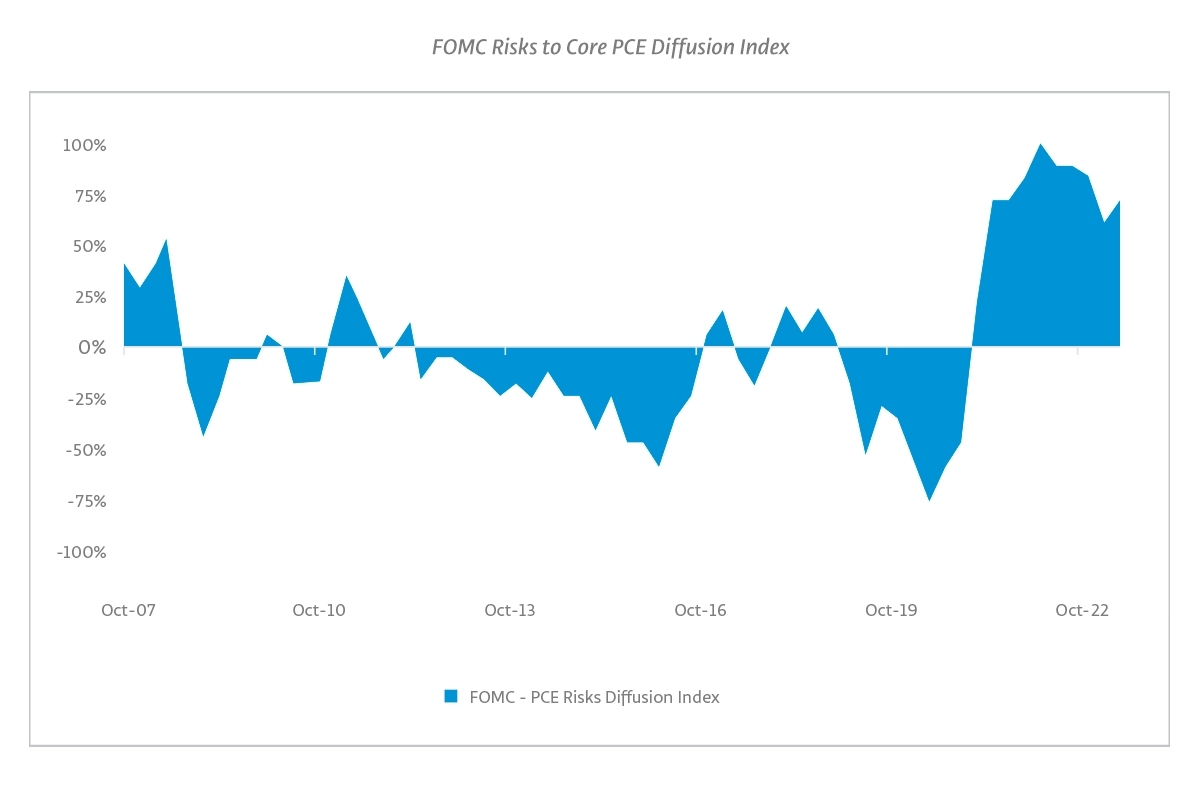
Importantly, a view that inflation risks are to the upside also continues to be shared by the participants of the FOMC, as can be tracked by the snappily titled ‘risks to core PCE diffusion index’ published along with the Summary of Economic Projections, where a reading above zero indicates that more participants see upside risks than downside risks.
FOMC Risks to Core PCE Diffusion Index6
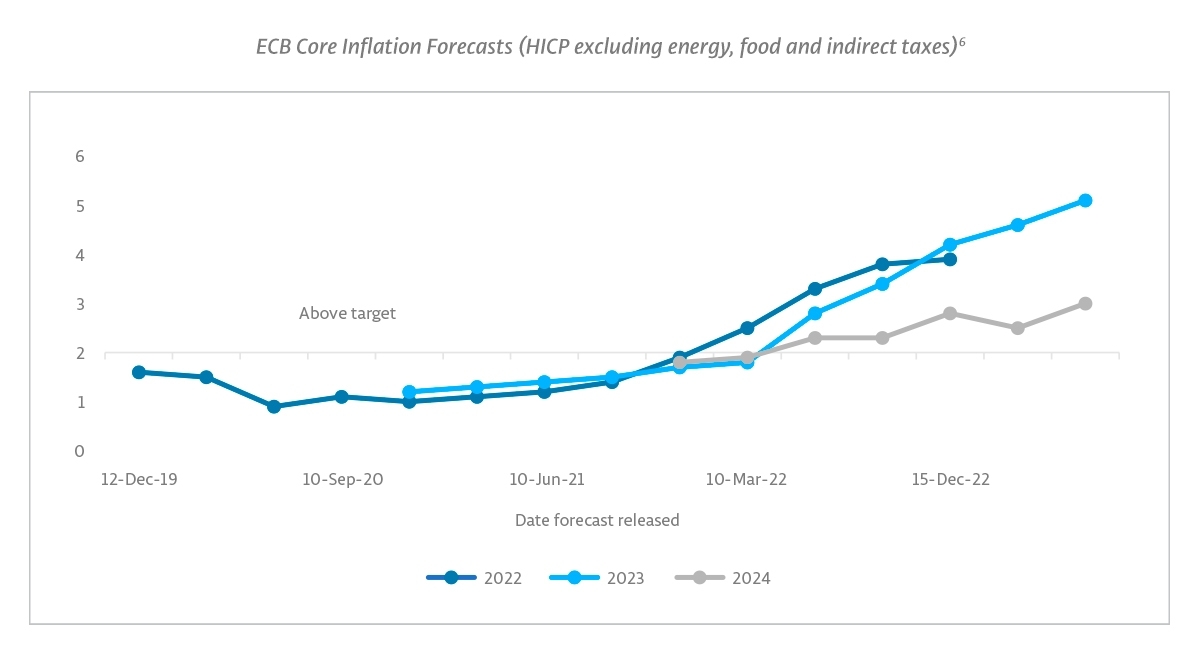
The persistence of inflation is also a global issue, which was reflected in the recent surprise rate hike by the Bank of Canada. In Europe, the ECB is battling continued inflation pressures, despite having hiked rates by 400bps in less than a year. As ECB President Christine Lagarde has succinctly remarked on more than one occasion recently, including to the G30 on 16 June, “Inflation has been coming down...but it is still projected to remain too high for too long.”7 A key focus for the ECB is the persistent pass through to wage inflation, Lagarde commenting at the Bank’s June meeting that: “Wage pressures, while partly reflecting one-off payments, are becoming an increasingly important source of inflation... Recent wage agreements in a number of countries have added to the upside risks to inflation.” The ECB’s core inflation projections remain on an upward trend for now. Until that changes, there will be continued pressure to tighten policy.
ECB Core Inflation Forecasts (HICP excluding energy, food and indirect taxes)8
In Asia (and beyond), eyes will be focused on Japan. Arguably, as inflation picks up in Japan, it could find itself in a comparable situation to Europe, with the added jeopardy of the weakening Yen turning into a rout, which would trigger interventions. While Governor Ueda has signaled his intention to take his time before making any major changes to the Bank of Japan’s stimulus program, a change in policy may well be in the cards.
While markets’ desired outcome - further reductions in inflation but avoiding an overly severe slowdown - may materialize, there remains ample room for disappointment. This is where the continued compression of implied volatilities comes in. One effect of the continued rally and sanguine market sentiment is a continuation of declines in volatility across most markets.
Implied and Realized Volatility – 16 June 2023
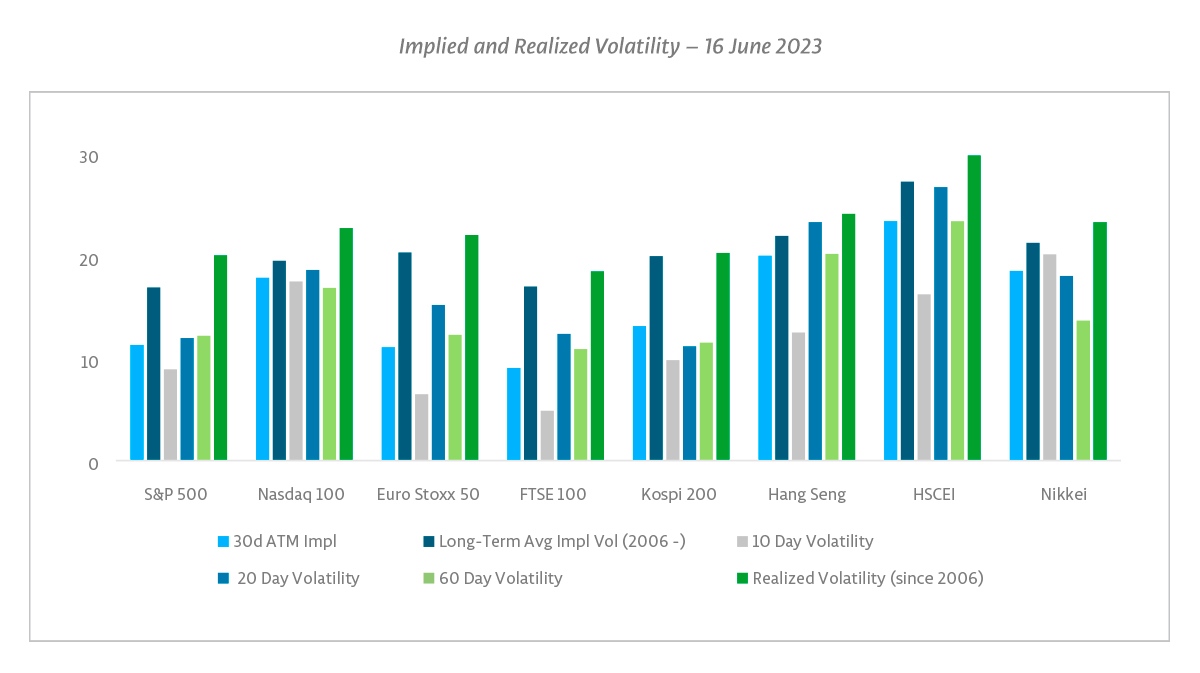
For all major global equity indices, the 30-day implied volatility is below the long-term average and in several markets meaningfully so. Implied volatility in the S&P 500, Kospi and Nikkei trade in their bottom quintile, while the Euro Stoxx 50 trades in its bottom decile. Moreover, compared to other low volatility periods such as 2017 the compression of volatility has not coincided with an equally severe reduction in day-to-day movement. The ‘volatility risk premium’ (essentially the movement priced into the market compared to the actual historical movement) is relatively low across markets and even negative for European and US markets on several variations of this measure. In other words, while long volatility positions provide convex payoffs in the event of markets shocks, the cost of holding (and delta-hedging) a long volatility position is relatively limited across markets. Should movement patterns in the near future mimic these of the recent past, for some markets holding volatility would benefit even in the absence of a market shock. Implied volatilities could also be supported in the case of further sharp upside movement, as we have seen recently in Japan’s Nikkei.
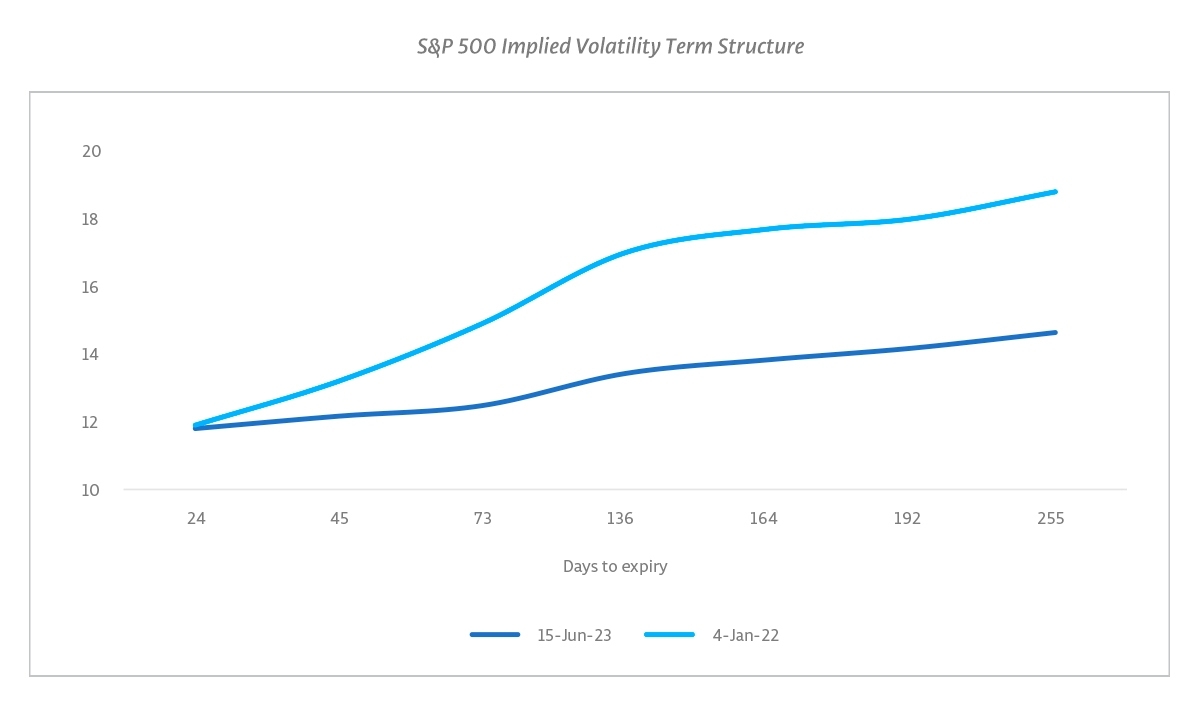
Another interesting aspect of the current market configuration is that the term structure is relatively flat as well. Generally speaking, in low-volatility environments market participants tend to be more comfortable selling shorter dated volatility as no near-term mayhem is expected but tend to be less sanguine further out. This would then translate into the shorter end of the curve being relatively depressed compared to the longer end. However, currently the differential between further out (6 to 9 month) and the front month is more limited. The graph below depicts the current term structure, as well as that of early January 2022 (when the term structure was relatively steep). The current depression of further out maturities, which tends to be the realm of systematic volatility sellers, does leave the market more exposed should a market panic develop.
S&P 500 Implied Volatility Term Structure
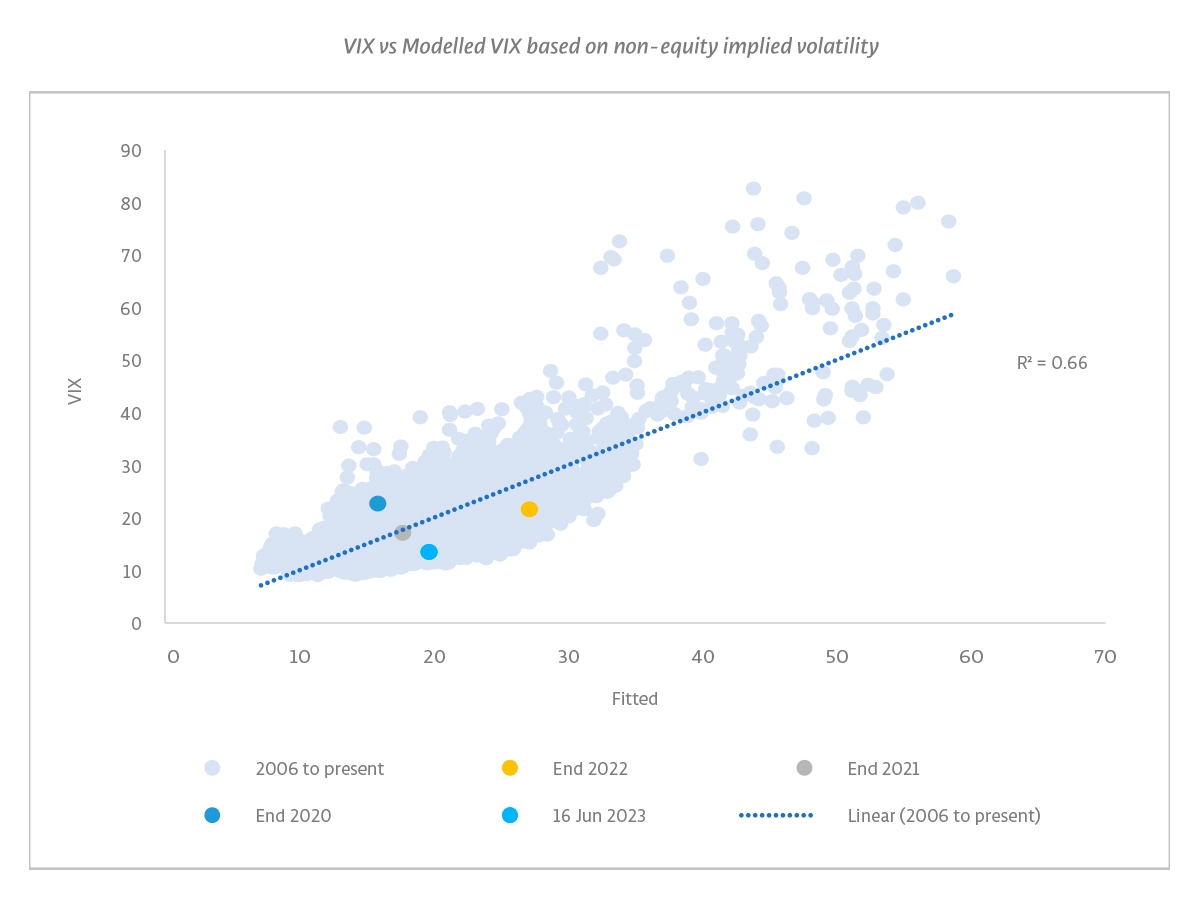
Furthermore, as we have raised before, equity volatility remains remarkably low compared to implied volatility in other asset classes. In the below chart, we show a model which estimates equity volatility (in terms of the VIX9 index; vertical axis) based on the levels of volatility in other asset classes. Current levels of equity volatility look unusually low compared to long-term relationships. In a similar analysis, the level of equity implied volatility (VIX) is around its lowest levels since 2006 when compared to the level of implied volatility in US Treasury bonds, as expressed in the MOVE10 index.
VIX vs Modelled VIX based on non-equity implied volatility
All being said, at this moment we believe there is ample support for the opinion that equity volatility is relatively low. But when considering any volatility strategy, one common talking point is timing. While there are storm clouds, we don’t see an immediate trigger for high volatility, which means we have to trade conscious of the risks of further compression. But that does not imply the current environment is prohibitive for engaging in a volatility strategy. Far from it. As we discussed above, it appears the market is relatively complacent in pricing volatility over the near future as well as somewhat further out and this pricing makes volatility markets more friendly to navigate for various volatility strategies, as well as for holding a volatility position in general.
Our research over the last year has had a focus on improving our understanding of the impact of different market environments on our strategy, as well as broadening and deepening our opportunity set. We have seen some fruit in that this year. Year-to-date, the MSCI World (TR, USD Hedged) and the S&P 500 have each gained +14%, while the short-term VIX futures ETF has lost approximately half its value. Generally, that has been a tougher backdrop for our relative value trading, but year-to-date the True Partner Fund has weathered the volatility environment relatively well, being effectively unchanged (-0.04%) for the year as of the end of May.
Looking forward, we maintain our stance that we are likely to see a return to the kind of historical behavior where we have seen bigger opportunities for volatility trading. At True Partner, we expect this to benefit our relative value strategy and also see an opportunity for investors with risk asset exposure to enter more directional volatility hedges at some of the most attractive levels we’ve seen since before the volatility spike in early 2020. We would be very happy to discuss potential options for investors to enter customized hedging solutions, which can also be combined with our relative value strategy within cash efficient structures.
–––––––––––––––––––––––––––––––
About the authors

Mr. Govert Heijboer, Co-CIO of True Partner, has been active as a market maker trading in the European and Asian derivatives markets as well as positional trading since 2003. Govert started as a trader/researcher at Saen Options in Amsterdam and rose to become the director of derivatives trading and a member of the executive team in 2007. In 2008 he moved to Hong Kong to set up and assume responsibility for all trading activities in the new Saen Options Hong Kong branch office. Govert holds a PhD in Management Science and an MSc in Applied Physics from the University of Twente, Netherlands. He is a founding partner and has worked on the launch of the True Partner Fund since March 2010.

Mr. Tobias Hekster, Co-CIO of True Partner, has been actively trading for the past 24 years in various different roles in several markets across the globe. Starting at IMC in 1998 as a pit trader in Amsterdam, Tobias has established the off-floor arbitrage desk, headed the Chicago office in the transition from floor trading to electronic trading and set up the Asian volatility arbitrage desk in Hong Kong. Tobias holds an MSc in Economics from University of Groningen, Netherlands. Next to his role as Senior Strategist, he taught as an Adjunct Associate Professor at the Chinese University of Hong Kong and as an Adjunct Professor of Financial Practice at National Taiwan University.

Mr. Robert Kavanagh, CFA, Head of Investment Solutions of True Partner, has been in the hedge fund industry since 2004 and joined True Partner in 2019. Prior to joining True Partner he was an Executive Director at Goldman Sachs Asset Management where he spent 15 years within the Alternative Investments & Manager Selection (AIMS) group. Robert has extensive experience investing in hedge funds and working with a wide range of hedge fund investors. Robert is a CFA charterholder and holds a First Class (Honours) BSc in Philosophy and Politics from the University of Bristol, UK, where he was awarded a Social Sciences Scholarship.
–––––––––––––––––––––––––––––––
The publication of this article is available as a PDF. Download it following the link below:
Are we near the top of the escalator?>>
–––––––––––––––––––––––––––––––
1. Market data is as of 16 June 2023 unless otherwise noted.
2. Source: JP Morgan Private Bank “Eye on the market” 14 June 2023
3. The day of the first rate hike of the cycle, 17 March 2022, the S&P 500 closed at a level of 4,411.67 points
4. Source: FactSet Earnings Insight
5. Source: Bloomberg, True Partner
6. Source: Bloomberg
7. Source: “Remarks by Christine Lagarde, President of the ECB, at the G30 dinner in Amsterdam”, ECB, 16 June 2023
8. Source: ECB macroeconomic projections, 2019 to 2023
9. Chigo Board Options Exchange Volatility Index
10. Merrill Lynch Option Volatility Estimate
- Investment Advisory in the new Space and AI age
- ”He will win who knows when to fight and when not to fight"
- Are we heading to a new ICE Age?
- AI Top or Slop: When Markets Reach Peak Magnificence
- The Hedge Fund Journal features True Partner's award-winning volatility strategies
- True Partner Fund wins award for strong performance
- True Partner releases new thought piece focused on Dutch pension funds
- True Partner Fund nominated for best performing relative value fund
- Bloomberg article highlights True Partner’s strong performance in April and year-to-date
- Bloomberg Publication: True Partner Volatility Hedge Fund Gains 5.9% During April Rout
- More news articles >
- Go to events >