Global Asset Management

True Partner article - Global cooling (in volatility): the calm before the storm?

Page 3: Volatility update January 2020

Volatility spread opportunities were limited

As our regular readers and investors know, periods of market uncertainty and unease typically create the best alpha opportunities for our strategy, as volatility spreads shift quickly due to varying changes in sentiment, flows and realized volatility. That enables us to deploy our 24-hour, global trading capability and technology edge to quickly identify and capitalize on dislocations. Perhaps unsurprisingly given the strong market returns, but to our disappointment, 2019 gave few opportunities for strong alpha.

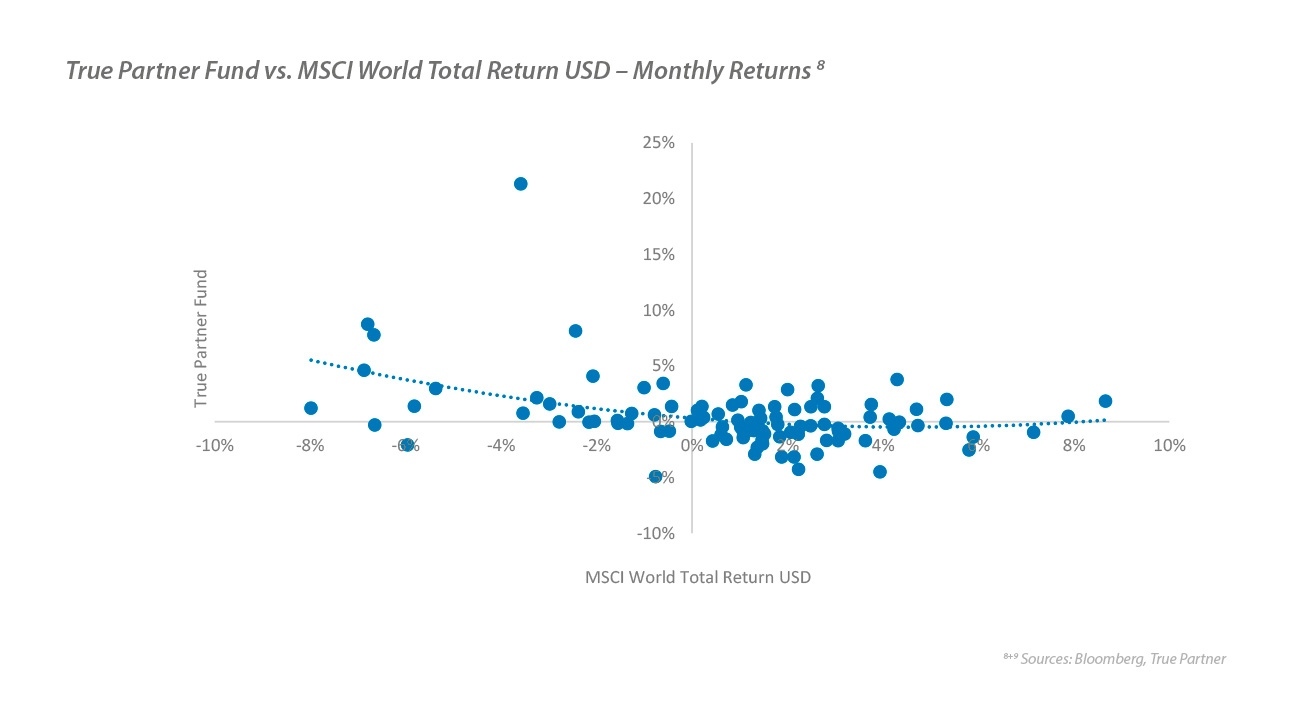
On the chart below, we show the monthly returns of the True Partner Fund on the vertical Y axis, and the monthly returns of the MSCI World Total Return USD on the horizontal X axis. The Fund has shown a negative correlation to the MSCI when the index is down, and almost no relationship when the index is up. We cannot promise to be up in every sell off, but we know that for many of our investors this is an important point of differentiation relative to most other assets and hedge funds.

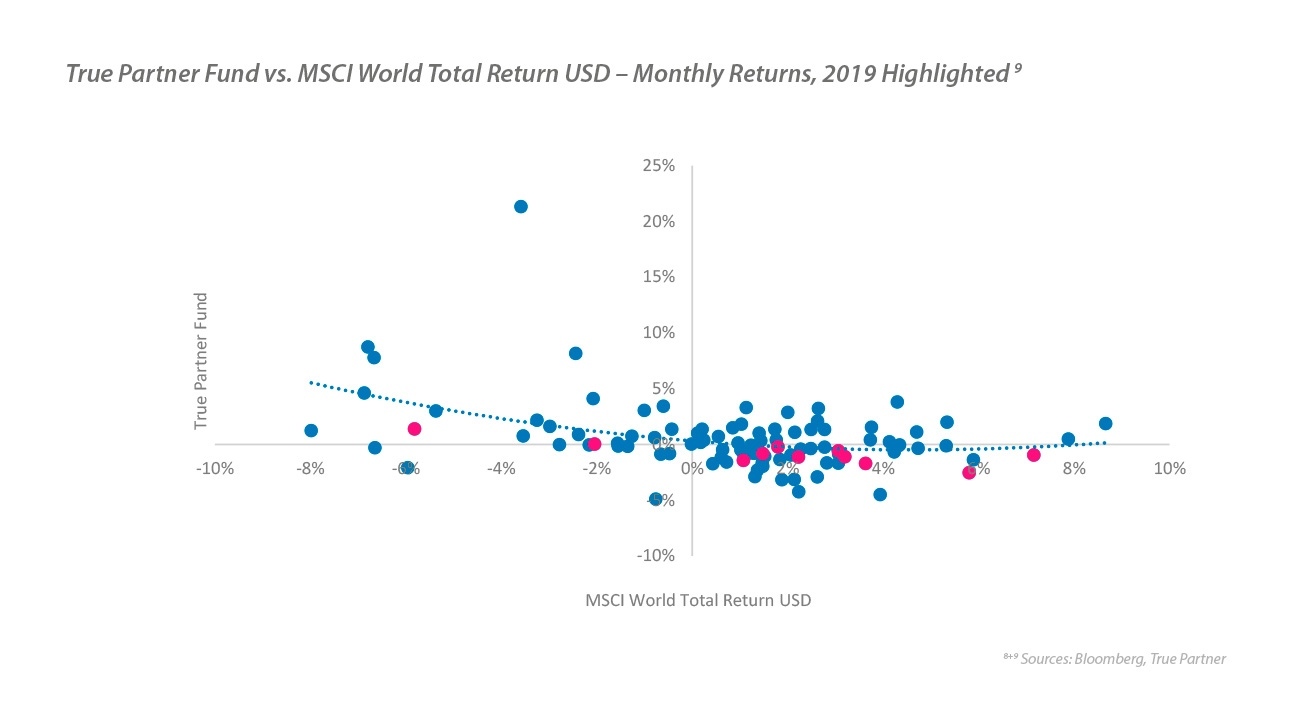
This relationship has resulted in the Fund having a negative beta to the MSCI of approximately -0.4 since inception in July 2011. From a beta-adjusted perspective, 2019 looks less bad for us, but we were disappointed to fall some way short of our historical annualized alpha of +9% per year, resulting in a negative year for investors. In the second chart below we show the same data but highlight the 2019 data points. We can see that the returns were well within the range of historical experience, but there was lower alpha than the historical average.

True Partner Fund vs. MSCI World Total Return USD – Monthly Returns 8

True Partner Fund vs. MSCI World Total Return USD – Monthly Returns

True Partner Fund vs. MSCI World Total Return USD – Monthly Returns, 2019 Highlighted 9

True Partner Fund vs. MSCI World Total Return USD – Monthly Returns, 2019 Highlighted

Why was spread trading more challenging?

We never like being down but were feeling ok at the end of Q1 2019, having retained most of our Q4 2018 profits in the risk on rally of Q1 2019. After gaining +5.9% when the MSCI World fell -12.9% in Q4 2018, the Fund gave back a little less than half this return (-2.3%) in Q1, while the MSCI World almost fully reversed its gain, being up +12.9% in Q1 2019. However, performance in Q2 and Q3 was disappointing. While the MSCI World was up in both quarters (and +5.7% over the whole period), there were short lived bouts of market unease in May and August that threw up only limited opportunities.

In May, the MSCI World fell -5.6%, while in August a month-end rally kept the decline to only -1.9%. True Partner continued to provide diversification in these months, generating positive returns while equities and broad hedge fund indices were down. However, spread behavior was relatively subdued, limiting alpha opportunities, and we were surprised by the under-reaction of Asian volatility in August to what was quite a large market sell-off (Hang Seng down -7.4% for the month, with a peak to trough drawdown of -9% early in the month, and larger if one includes the end of July sell-off). This resulted in smaller profits than we had hoped for in August.

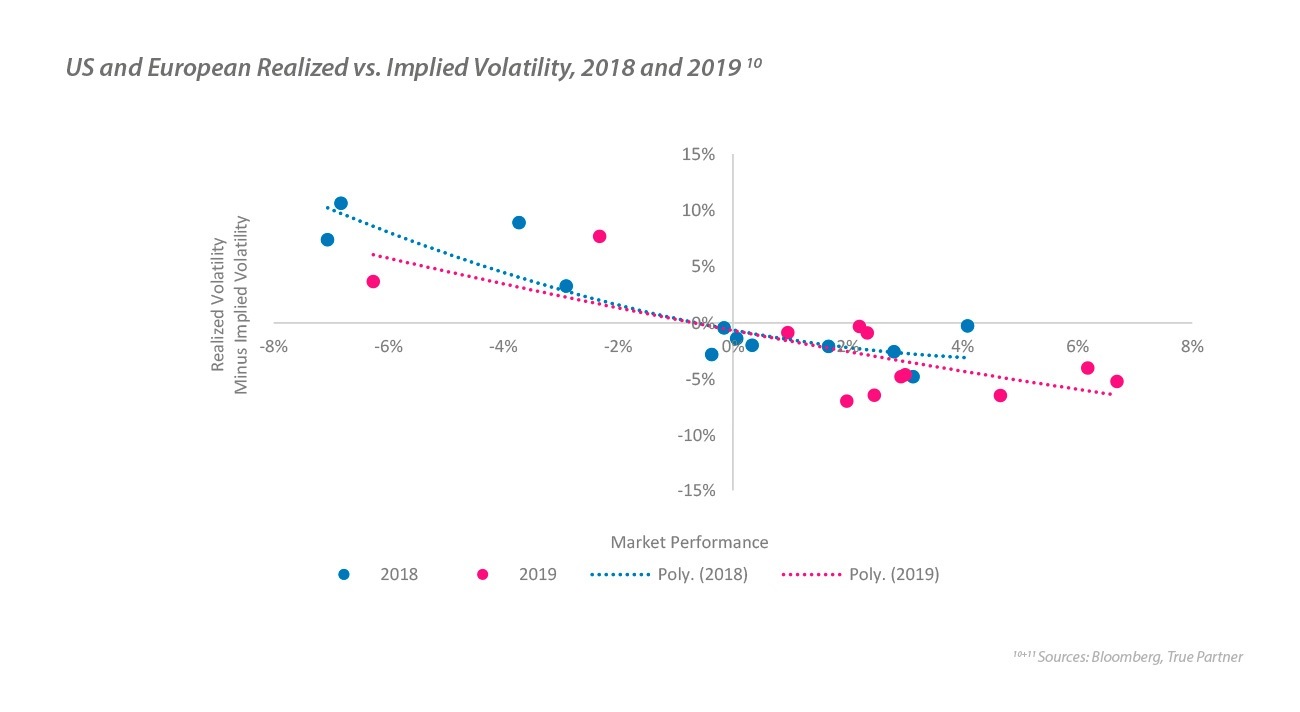
While we trade individual RV relationships, rather than at the regional level, and reposition daily, not monthly, the charts below help illustrate this. In each chart we show the difference between 1-month realized and 1-month implied volatility on the Y axis (so a positive number means that realized volatility came in higher than the market was expecting) and the market return on the X axis. To construct these series, first we construct regional data for the US, Europe and Asia by taking a simple average of the markets we trade in each region. We then average the US and European series to compare Asian vs. non-Asian volatility.

The first chart shows that non-Asian volatility had similar reactions to big up and down months for the underlying equity markets in 2018 and 2019, as shown in the first chart below, with a negative relationship between the volatility ‘surprise’ and the market return.

US and European Realized vs. Implied Volatility, 2018 and 2019 10

US and European Realized vs. Implied Volatility, 2018 and 2019

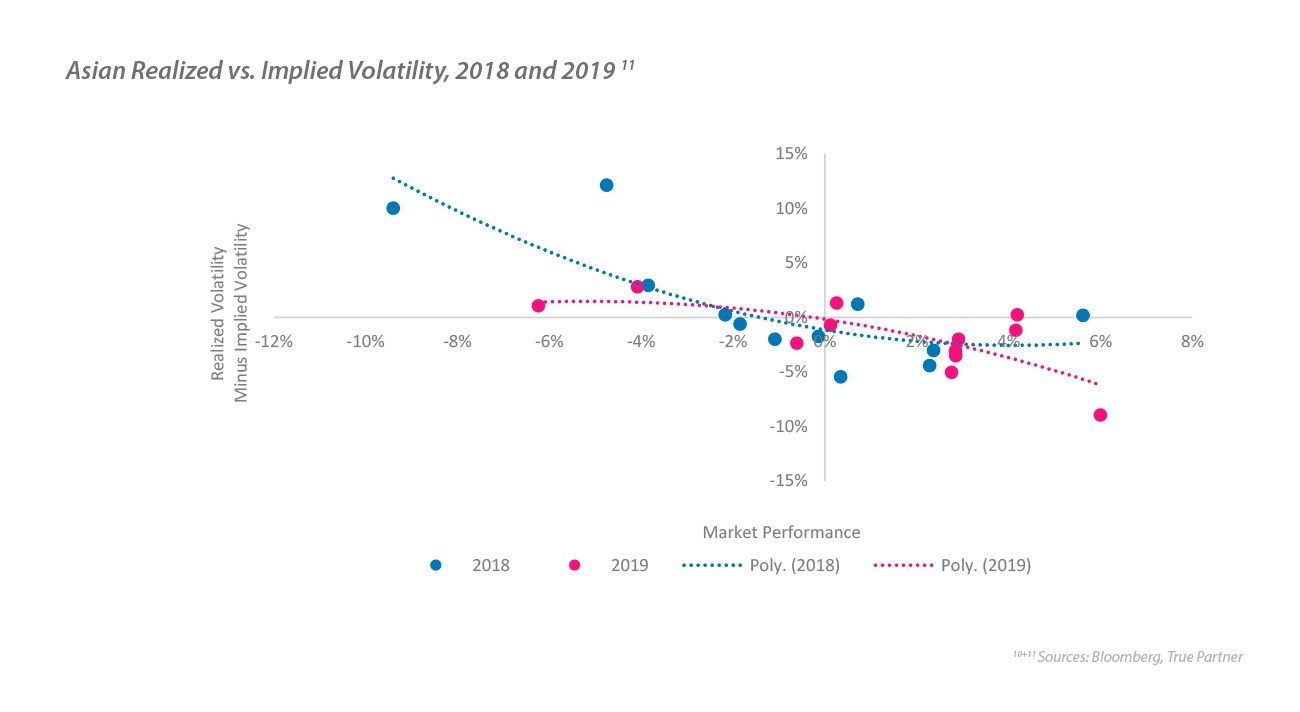
The chart below shows the Asian volatility ‘surprise’ vs. the performance of the underlying Asian indices. In 2018, Asian volatility reacted similarly to non-Asian volatility, with even higher rises in realized volatility (relative to implied) on downside moves – a help to long option positions. However, in 2019, realized volatility had a subdued reaction (relative to implied) making it a relatively unrewarding long position in what was a large sell-off for the market. While Hong Kong has often hit the headlines due to political tensions and protests in 2019, from a market perspective it has been remarkably calm on a relative basis.

Asian Realized vs. Implied Volatility, 2018 and 2019 11

Asian Realized vs. Implied Volatility, 2018 and 2019

-

Continue reading to the next page of this article >>

–––––––––––––––––––––––––––––––

The full publication of this article is available as a PDF. Download it following the link below:
January 2020 Volatility Update - Global cooling>>

–––––––––––––––––––––––––––––––

1. nytimes.com
2. Sources: Bloomberg, True Partner, Eurekahedge. True Partner Fund returns are Class B, USD, net of 2/20 fees.
3. cnbc.com
4. Sources: Federal Reserve, True Partner federalreserve.gov, federalreserve.gov
5. Sources: Bloomberg, True Partner. Kospi 200 value is the simple average of the last two trading days of December and the first trading day of January as liquidity is more limited beyond 6-month maturities.
6 -12. Sources: Bloomberg, True Partner
13. wsj.com
14. For those intrigued, the consensus forecast for 2008 S&P 500 returns was for an +11.1% gain – this miss accounts for a significant part of the on average over-optimistic bias.
15. nytimes.com
16. wsj.com
17. libertystreeteconomics.newyorkfed.org; on liquidity see libertystreeteconomics.newyorkfed.org and bankunderground.co.uk
18. US PredictIt 2020 Senate Party Control Democratic, as of January 10, 2020
19. bbc.com
20. Data from policyuncertainty.com based on the paper: Caldara, Dario and Matteo Iacoviello, “Measuring Geopolitical Risk,” working paper, Board of Governors of the Federal Reserve Board, 2017”.
21. Source: policyuncertainty.com
22. Source: Bloomberg Negative Yielding Debt Index Market Value, as of January 10, 2020
23. Source: Bloomberg, as of January 10, 2020
24. Source: Bloomberg Negative Yielding Debt Total Return Index

–––––––––––––––––––––––––––––––

Published by Ralph van Put

Latest news articles

Website Privacy Statement and Disclaimer for Fund

Privacy Statement

True Partner respects your privacy. This Privacy Statement describes the types of personal information we collect on the website, how we may use the information, the purposes for which we may use it, and with whom we may share it.

By visiting or submitting information to this website, you are accepting and consenting to the provisions set forth in this privacy statement. If you do not agree to this privacy statement, please do not use this website.

True Partner may obtain personal information through this website, including when you send us a contact message which includes your name, e-mail address, telephone number, and any other information you provide in the message box.

During your use of this website, technical and usage data pertaining to your device and/or Internet connection is collected, including your Internet browser type, your preferences on this website, your IP address and other of your device characteristics. This is undertaken in order to manage best website experience and enhance the safety and security of the website. This technical and usage data is obtained using "cookies" or other similar technologies. In compliance with relevant law, we may retain information as needed or appropriate to serve our legitimate business purposes or as required by law.

True Partner will not sell or rent your personal information to anyone. Your personal information (e.g., IP address) will be available to our technical service providers who are administering and storing our website data. They are not authorized to use or disclose your personal information except as necessary to perform services on our behalf or comply with legal requirements.

True Partner maintains safeguards designed to protect personal information from loss, misuse, and unauthorized access, disclosure, alteration, and destruction.

This website may contain links to other websites for your convenience and information. Linked websites may have their own privacy policies or notices, which we suggest you review if you visit any linked websites. We are not responsible for the content of any websites, any use of those websites, or the privacy practices of those websites.

Additional information regarding our personal data processing purposes and the rights of those natural persons whose personal data we process can be found in our additional General Privacy Statement (pdf file).

Please contact us at phone number +1 312 675 6126 if you have any questions about this privacy statement or the personal data we hold about you.


Disclaimer
All information contained on this website is for informational purposes only. This information is not in any way intended to solicit investment. It is important that you do not use this website to request, authorize or affect the purchase or sale of any security, to send fund transfer instructions, to affect any other transactions or to send time sensitive instructions. Nothing in this information constitutes investment, legal, accounting or tax advice, or a representation that any investment or strategy is suitable or appropriate for your individual circumstances. Any discussions of past performance should not be taken as an indication of future results, and no representation, expressed or implied, is made regarding future results. You should consider the specific return and risk profile of any investment or strategy before effecting, or agreeing to effect, any transaction.

Fund Disclaimer
This document has been prepared and issued by True Partner Advisor (“True Partner”). This presentation is confidential, is intended only for the person to whom it has been provided and under no circumstance may a copy be shown, copied, transmitted, or otherwise given to any person other than the authorized recipient without the prior written consent of True Partner. Notwithstanding the foregoing, an investor may disclose to any and all persons, without limitation of any kind, the tax treatments and tax structure of True Partner Fund, (the “Fund” or “Offering”) and all materials of any kind, including opinions or other tax analyses that are provided to the investor relating to such tax treatment and tax structure. The distribution of the information contained herein in certain jurisdictions may be restricted, and, accordingly, it is the responsibility of any prospective investor to satisfy itself as to compliance with relevant laws and regulations.

Nothing herein constitutes an offer to sell, or solicitation of an offer to purchase, any securities, nor does it constitute an endorsement with respect to any investment strategy or vehicle. Any offer of securities may be made only by means of a Confidential Memorandum (the “Memorandum”), which contains additional information about the Fund and expenses associated with an investment therein, only to sophisticated investors in jurisdictions where permitted by law. All relevant Offering Documents should be carefully reviewed before investing. Any decision to invest in the Fund should be based solely on the information included in the Memorandum. In the case of any inconsistency between the descriptions or terms in this presentation and the Memorandum, the Memorandum shall control.

Past performance is not indicative of future results. The information contained herein is preliminary, is provided for discussion purposes only as a summary of key information, is not complete and does not contain certain material information about the Offering. The information contained herein does not take into account any particular investment objectives or financial circumstances of any specific person who may receive it. Parties should independently investigate any investment strategy or manager, and should consult their own advisors as to legal, tax, accounting, regulatory and related matters prior to investing. These materials may contain historical market data; however, historical market trends are not reliable indicators of future market behavior. Due to, among other things, the volatile nature of the markets and the investment strategies discussed herein, the investment strategies may only be suitable for certain investors. There can be no assurance that the Offering will have a return on capital similar to historical returns provided because, among other reasons, there may be differences in economic conditions, regulatory climate, portfolio size, leverage use, expenses and structure, as well as investment policies and techniques. Any information provided with respect to how the portfolio will be constructed is merely a guideline, which True Partner may change at any time in its sole discretion. Unless otherwise indicated, the information contained herein is believed to be accurate as of the date indicated. No representation or warranty is made as to its continued accuracy after such date.

The Fund is not registered under the Investment Company Act of 1940, as amended, in reliance on an exception thereunder. Interests in the Fund has not been registered under the Securities Act of 1933, as amended, or the securities laws of any state; they are being offered and sold in reliance on exemptions from the registration requirements of said Act and laws. Neither the Fund’s Operative Documents, nor the offering of its limited partnership interests, have been reviewed or approved by U.S. federal or state regulators. Interests in the Offering are not deposits or obligations of, or guaranteed or endorsed by, any bank or other insured depository institution, and are not federally insured by the Federal Deposit Insurance Corporation, The Federal Reserve Board or any other governmental agency. The interests issued by the Fund are offered or otherwise made available only in accordance with available, applicable private placement or offering rules.

An investment in the Offering is illiquid and there are significant restrictions on transferring the Funds’ limited partnership interests. There are no secondary markets for the Fund’s limited partnership interests and none are expected to develop. True Partner has sole discretion regarding the allocation of the Fund assets. The Fund represents a speculative investment and involves a high degree of risk. The Fund’s portfolio, which is under the sole trading authority of True Partner, is principally an Equity Volatility Arbitrage fund. This lack of diversification may result in higher risk.

A private fund is generally not subject to the same regulatory oversight and/or regulatory requirements as a mutual fund. The Offering is not required to provide periodic pricing or valuation information to investors. Investments may involve complex tax structures resulting in delays in distributing important tax information.

Certain instruments may have no readily available market or third party pricing. Performance may be volatile as private funds may employ leverage and other speculative investment practices that may increase the risk of investment loss, and adherence to risk control mechanisms does not guarantee investment returns. Additionally, fees may offset an investor’s profits. A comprehensive list of potential risk factors is outlined in the Offering Documents.

Investing in the financial markets involves a substantial degree of risk. There can be no assurance that the investment objectives described herein will be achieved. Investment losses may occur, and investors could lose some or all of their investment and successfully overcoming barriers to entry, e.g., legal and regulatory enterprise does not guarantee successful investment performance. No guarantee or representation is made that the Fund’s investment program, including, without limitation, its investment objectives, strategies or risk monitoring goals, will be successful and investment results may vary substantially over time. Investment losses may occur from time to time. Nothing herein is intended to imply that the Fund’s investment methodology should be considered “conservative”, “safe”, “risk free” or “risk averse.” An investment in any fund should be discretionary capital set aside strictly for speculative purposes.

Certain information contained in this document contains: forward-looking statements” which can be identified by the use of forward-looking terminology such as “may”, “will”, “should”, “expect”, “anticipate”, “target”, “project”, “estimate”, “intend”, “continue” or “believe” or the negatives thereof or other variations thereon or comparable terminology. Due to various risks and uncertainties, actual events or results or the performance of the Fund may differ materially from those reflected or contemplated in such forward-looking statements. Forward looking information is subject to inherent uncertainties and qualifications and could be based on numerous assumptions. Forward looking information is provided for illustrative purposes only and is not intended to serve as, and must not be relied upon by any investor as, a guarantee, an assurance, a prediction or a definitive statement of fact or probability.

Performance Methodology: Past performance is not an indicator of future performance. Annualized Returns or Performance figures for True Partner Fund are based on Class B shares and are shown on a net basis after the deduction of a 2% management fees and a 20% performance fee, trading related and other expenses that an investor would have or actually paid.

The indexes’ performances do not reflect the deduction of transaction costs, management fees, or other costs which would reduce returns. References to market or composite indexes, benchmarks or other measures of relative market performance (indexes) over a specified period of time are provided for your information only and do not imply that a portfolio will achieve similar returns, volatility or other results. The composition of an index may not reflect the manner in which a portfolio is constructed in relation to expected or achieved returns, portfolio guidelines, restrictions, sectors, correlations, concentrations, volatility or tracking error targets, all of which may change over time. Indexes are used as performance benchmarks only, as True Partner does not attempt to replicate an index. The composition of the indexes is not necessarily similar to accounts managed by True Partner. The prior performance of the indexes will not be predictive of the future performance of accounts managed by True Partner. An investor may not invest directly in an index.