Global Asset Management

True Partner article: If the market ain’t broken, Vix it before it will

So far, 2022 has served a rather unappetizing stew of continued supply chain issues, war in continental Europe, crypto distress and continued inflationary readings feeding into rapidly rising bond yields. Against this backdrop, in June, the S&P 500 and Euro Stoxx 50 indices flirted with a bear market (down around 20% year-to-date) as the post-Covid optimism of 2021, which lifted the S&P 500 an impressive 27% last year, appeared to have faded. Since mid-June, markets have rallied in the optimistic expectation that the current path of moderate rate hikes will contain inflation, while allowing for the gentlest of soft landings.

But amid the negative headlines and storm clouds, one surprise has been the muted response of equity index volatility. One common indicator is the VIX index, which measures 30-day S&P 500 implied volatility. Despite the S&P 500 being down close to 10% year-to-date at the time of writing, the VIX is little changed year-to-date at 19.7 vs 17.2 at year-end 20211. The VIX September future (the current front-month contract) is down year-to-date, declining from 26.3 at the end of 2021 to 23.4 as of 16 August 2022. It peaked at just over 30 in mid-June, when the S&P 500 was down 22% YTD. In contrast during the equity drawdown in early 2020 the VIX jumped from 14 to over 80 in around four weeks.

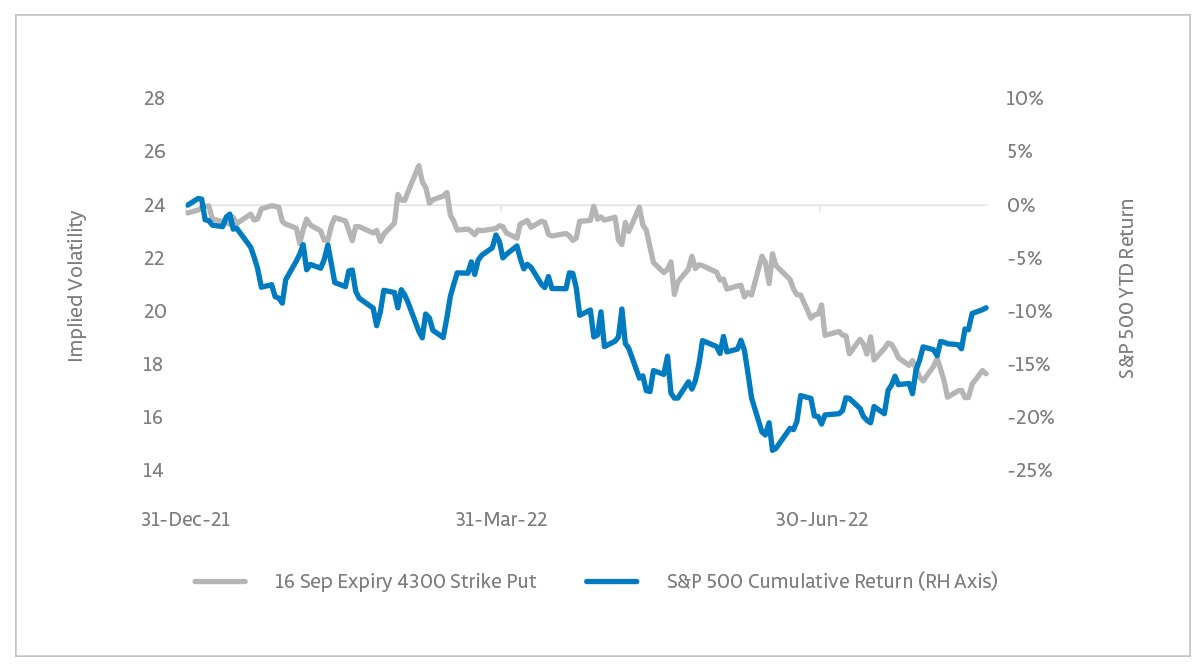
When looking at the VIX, it is important to recall that the VIX is primarily based on taking a snapshot of at-the-money implied volatility. When the underlying equity market falls, the reference strikes used to calculate the VIX change, moving lower. These lower strikes typically trade at a premium to at-the-money options. Thus, changes in the VIX are driven both by changes in the reference strike as well as changes in ‘per-strike’ implied volatility, i.e. the volatility of individual options. Therefore, when the market declines and the VIX remains unchanged or even falls (which we have seen in several weeks this year) that typically means ‘per strike’ volatility has declined quite meaningfully. Thus, it is also useful to look at the volatility of individual options. The below chart shows the volatility of the current at-the-money contract (the S&P 500 September 4300 Put) as well as the underlying index year-to-date. Notably, the implied volatility of this contract has decreased from 24% to approximately 18% despite the market’s decline.2

Implied volatility 2

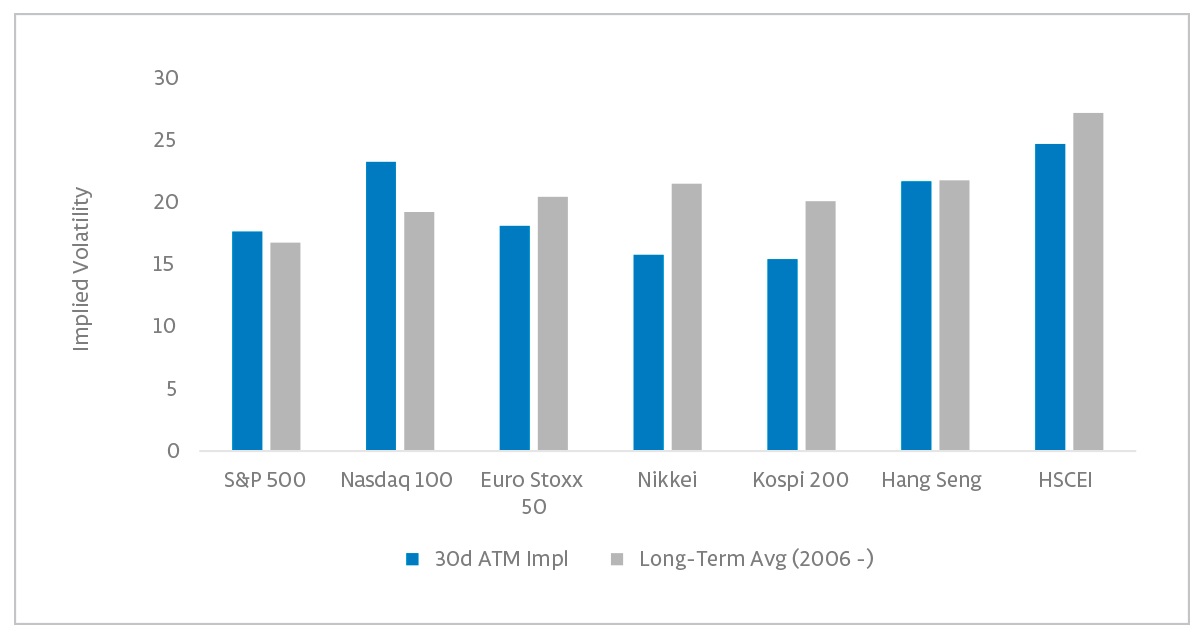
This development was not limited to the US, but also occurred in several others, including the Euro Stoxx 50 and Korea’s Kospi 200 (both of which are down around 10% or more year-to-date). As a result, despite the equity declines, equity index implied volatilities are currently generally only around their long-term averages, with some Asian markets below.3 This is a contrast to implied volatility behaviour in some other asset classes: for example, the MOVE Index of US Treasury implied volatility is substantially above its long-term average.4

Implied volatility 2

But not only at-the-money volatilities have compressed. In early 2022, it was notable that downside skew (the degree to which market participants are prepared to pay more for downside protective strikes) was relatively expensive, which we saw as indicative of end-users holding hedges. Monetization of these hedges appeared to be one factor in the muted responsiveness of volatility in earlier market troughs. But for those who were waiting for bigger moves, holding volatility hedges has been a surprising ‘pain trade’ this year. Now the pendulum appears to have swung to the other side, as the current volatility structure appears to indicate less hedges held by end-users: dealer positioning on the downside is light and skews, if anything, are depressed historically. In other words, likely more investors are now ‘swimming naked’.

Interestingly, the developments in volatility and skew make now a more favourable entry point for any protective strategies applying volatility hedges, not least as one aspect of lower volatilities and skews is that the bar for a severe market surprise is lowered. In the current volatility landscape, a 3.5% decline in the S&P 500 would already constitute a three-sigma event, which would likely stir options markets to a larger extent than what we’ve seen earlier this year.

That brings us to what to expect for the coming months. In our view, unabating inflation and the increasingly hawkish central bank responses remain the markets’ key focus. While the Federal Reserve has commenced its tightening cycle, as recently as late March the median of the FOMC participants’ projections suggested the Fed Funds rate would peak below 3%. Since then, inflation data has mostly continued to surprise on the upside. But the current expected peak of just over 3.5% would still be low by historical standards. While inflationary pressures have generally been low since the 2008 Global Financial Crisis until recently, prior real rates were more significantly positive and tightening cycles usually ended with notably higher real interest rates. Thus, the risk of central banks still being behind the curve is tangible. In Europe, the ECB has a particularly tough job, with high inflation, growth concerns and the risk of fragmentation limiting the ECB’s ability to raise rates, while even the ECB staff union has been complaining that pay is not sufficiently protected against inflation.5

While markets price a velvet-like soft landing, doubts also remain on the economy itself. Inflationary data has been interspersed with recessionary signals, including the whopping miss of US GDP and deterioration of the US housing markets (itself somewhat of a deja-vu from the late 2000’s). Furthermore, the main gist of the second quarter earnings season ‘not being as bad as feared’ does not inspire confidence for the upcoming quarter. Besides all this, there is the unfortunate prospect of severe energy shortages across Europe in the coming winter season. With inflation still looming large, the traditional role of government bonds as a ‘safe-haven’ still seems challenged, despite already substantial losses for bonds YTD.6

In these times of uncertainty volatility can be a useful component to any investment portfolio. Volatility strategies can be both a source of return and a diversifier. The asymmetric pay-off patterns of options allows for inefficiencies to exist in volatility markets, as market participants can trade the same option with different objectives, but also because of the complexities involved: relative value volatility analysis can require large volumes of data and an understanding of individual market nuances, flows and liquidity dynamics.

An additional benefit of options is the ability to customize a strategy and portfolio to the objectives of the investor, for a more tailor-made solution. Where managers have the right capabilities, customization can enable volatility strategies to be tailored and combined to meet specific portfolio objectives, such as protecting against tail risks. This can further enhance diversification benefits and potentially achieve better overall portfolio outcomes.

Net, as we approach a still uncertain market environment, there is a silver lining in the subdued equity index volatility response seen so far in 2022: the current market configuration presents a more attractive entry point for considering equity index volatility strategies, particularly relative to other asset classes. For savvy investors, this could offer the potential to enhance risk-adjusted returns.

–––––––––––––––––––––––––––––––

About the authors

Govert Heijboer, co-CIO of True Partner Capital

Mr. Govert Heijboer, Co-CIO of True Partner, has been active as a market maker trading in the European and Asian derivatives markets as well as positional trading since 2003. Govert started as a trader/researcher at Saen Options in Amsterdam and rose to become the director of derivatives trading and a member of the executive team in 2007. In 2008 he moved to Hong Kong to set up and assume responsibility for all trading activities in the new Saen Options Hong Kong branch office. Govert holds a PhD in Management Science and an MSc in Applied Physics from the University of Twente, Netherlands. He is a founding partner and has worked on the launch of the True Partner Fund since March 2010.

Tobias Hekster, co-CIO of True Partner Capital

Mr. Tobias Hekster, Co-CIO of True Partner, has been actively trading for the past 22 years in various different roles in several markets across the globe. Starting at IMC in 1998 as a pit trader in Amsterdam, Tobias has established the off-floor arbitrage desk, headed the Chicago office in the transition from floor trading to electronic trading and set up the Asian volatility arbitrage desk in Hong Kong. Tobias holds an MSc in Economics from University of Groningen, Netherlands. Next to his role as Senior Strategist, he taught as an Adjunct Associate Professor at the Chinese University of Hong Kong and as an Adjunct Professor of Financial Practice at National Taiwan University.

Mr. Robert Kavanagh, CFA, Head of Investment Solutions of True Partner, has been in the hedge fund industry since 2004 and joined True Partner in 2019. Prior to joining True Partner he was an Executive Director at Goldman Sachs Asset Management where he spent 15 years within the Alternative Investments & Manager Selection (AIMS) group. Robert has extensive experience investing in hedge funds and working with a wide range of hedge fund investors. Robert is a CFA charterholder and holds a First Class (Honours) BSc in Philosophy and Politics from the University of Bristol, UK, where he was awarded a Social Sciences Scholarship.

–––––––––––––––––––––––––––––––

The publication of this article is available as a PDF. Download it following the link below:
If the market ain’t broken, Vix it before it will>>

–––––––––––––––––––––––––––––––

1. As of 16 August 2022
2. Data as of 16 August 2022 unless stated. LH axes show implied volatility at mid prices Nothing herein constitutes an offer or a solicitation of an offer to purchase a security. Past performance does not guarantee or indicate future results. Sources: True Partner, Bloomberg.
3. Uses 30-day at-the-money implied. Long-term averages use data from January 2006 to 16 August 2022. Data as of 16 August 2022 unless stated. Sources: True Partner, Bloomberg.
4. Using the same period of Jan 2006 to 16 August 2022
5. ‘Lagarde spurns ECB staff plea for pay rises linked to prices’, Bloomberg News, 9 May 2022
https://www.bloomberg.com; see also ‘ECB Staff Union Demands More Pay to Guard Against Inflation’, Bloomberg News, 24 Nov 2021 https://www.bloomberg.com
6. For example, the Bloomberg US Treasury: Long index of 10Y+ maturity government bonds is down -20% YTD as of 16 August 2022

Latest news articles

Website Privacy Statement and Disclaimer for Fund

Privacy Statement

True Partner respects your privacy. This Privacy Statement describes the types of personal information we collect on the website, how we may use the information, the purposes for which we may use it, and with whom we may share it.

By visiting or submitting information to this website, you are accepting and consenting to the provisions set forth in this privacy statement. If you do not agree to this privacy statement, please do not use this website.

True Partner may obtain personal information through this website, including when you send us a contact message which includes your name, e-mail address, telephone number, and any other information you provide in the message box.

During your use of this website, technical and usage data pertaining to your device and/or Internet connection is collected, including your Internet browser type, your preferences on this website, your IP address and other of your device characteristics. This is undertaken in order to manage best website experience and enhance the safety and security of the website. This technical and usage data is obtained using "cookies" or other similar technologies. In compliance with relevant law, we may retain information as needed or appropriate to serve our legitimate business purposes or as required by law.

True Partner will not sell or rent your personal information to anyone. Your personal information (e.g., IP address) will be available to our technical service providers who are administering and storing our website data. They are not authorized to use or disclose your personal information except as necessary to perform services on our behalf or comply with legal requirements.

True Partner maintains safeguards designed to protect personal information from loss, misuse, and unauthorized access, disclosure, alteration, and destruction.

This website may contain links to other websites for your convenience and information. Linked websites may have their own privacy policies or notices, which we suggest you review if you visit any linked websites. We are not responsible for the content of any websites, any use of those websites, or the privacy practices of those websites.

Additional information regarding our personal data processing purposes and the rights of those natural persons whose personal data we process can be found in our additional General Privacy Statement (pdf file).

Please contact us at phone number +1 312 675 6126 if you have any questions about this privacy statement or the personal data we hold about you.


Disclaimer
All information contained on this website is for informational purposes only. This information is not in any way intended to solicit investment. It is important that you do not use this website to request, authorize or affect the purchase or sale of any security, to send fund transfer instructions, to affect any other transactions or to send time sensitive instructions. Nothing in this information constitutes investment, legal, accounting or tax advice, or a representation that any investment or strategy is suitable or appropriate for your individual circumstances. Any discussions of past performance should not be taken as an indication of future results, and no representation, expressed or implied, is made regarding future results. You should consider the specific return and risk profile of any investment or strategy before effecting, or agreeing to effect, any transaction.

Fund Disclaimer
This document has been prepared and issued by True Partner Advisor (“True Partner”). This presentation is confidential, is intended only for the person to whom it has been provided and under no circumstance may a copy be shown, copied, transmitted, or otherwise given to any person other than the authorized recipient without the prior written consent of True Partner. Notwithstanding the foregoing, an investor may disclose to any and all persons, without limitation of any kind, the tax treatments and tax structure of True Partner Fund, (the “Fund” or “Offering”) and all materials of any kind, including opinions or other tax analyses that are provided to the investor relating to such tax treatment and tax structure. The distribution of the information contained herein in certain jurisdictions may be restricted, and, accordingly, it is the responsibility of any prospective investor to satisfy itself as to compliance with relevant laws and regulations.

Nothing herein constitutes an offer to sell, or solicitation of an offer to purchase, any securities, nor does it constitute an endorsement with respect to any investment strategy or vehicle. Any offer of securities may be made only by means of a Confidential Memorandum (the “Memorandum”), which contains additional information about the Fund and expenses associated with an investment therein, only to sophisticated investors in jurisdictions where permitted by law. All relevant Offering Documents should be carefully reviewed before investing. Any decision to invest in the Fund should be based solely on the information included in the Memorandum. In the case of any inconsistency between the descriptions or terms in this presentation and the Memorandum, the Memorandum shall control.

Past performance is not indicative of future results. The information contained herein is preliminary, is provided for discussion purposes only as a summary of key information, is not complete and does not contain certain material information about the Offering. The information contained herein does not take into account any particular investment objectives or financial circumstances of any specific person who may receive it. Parties should independently investigate any investment strategy or manager, and should consult their own advisors as to legal, tax, accounting, regulatory and related matters prior to investing. These materials may contain historical market data; however, historical market trends are not reliable indicators of future market behavior. Due to, among other things, the volatile nature of the markets and the investment strategies discussed herein, the investment strategies may only be suitable for certain investors. There can be no assurance that the Offering will have a return on capital similar to historical returns provided because, among other reasons, there may be differences in economic conditions, regulatory climate, portfolio size, leverage use, expenses and structure, as well as investment policies and techniques. Any information provided with respect to how the portfolio will be constructed is merely a guideline, which True Partner may change at any time in its sole discretion. Unless otherwise indicated, the information contained herein is believed to be accurate as of the date indicated. No representation or warranty is made as to its continued accuracy after such date.

The Fund is not registered under the Investment Company Act of 1940, as amended, in reliance on an exception thereunder. Interests in the Fund has not been registered under the Securities Act of 1933, as amended, or the securities laws of any state; they are being offered and sold in reliance on exemptions from the registration requirements of said Act and laws. Neither the Fund’s Operative Documents, nor the offering of its limited partnership interests, have been reviewed or approved by U.S. federal or state regulators. Interests in the Offering are not deposits or obligations of, or guaranteed or endorsed by, any bank or other insured depository institution, and are not federally insured by the Federal Deposit Insurance Corporation, The Federal Reserve Board or any other governmental agency. The interests issued by the Fund are offered or otherwise made available only in accordance with available, applicable private placement or offering rules.

An investment in the Offering is illiquid and there are significant restrictions on transferring the Funds’ limited partnership interests. There are no secondary markets for the Fund’s limited partnership interests and none are expected to develop. True Partner has sole discretion regarding the allocation of the Fund assets. The Fund represents a speculative investment and involves a high degree of risk. The Fund’s portfolio, which is under the sole trading authority of True Partner, is principally an Equity Volatility Arbitrage fund. This lack of diversification may result in higher risk.

A private fund is generally not subject to the same regulatory oversight and/or regulatory requirements as a mutual fund. The Offering is not required to provide periodic pricing or valuation information to investors. Investments may involve complex tax structures resulting in delays in distributing important tax information.

Certain instruments may have no readily available market or third party pricing. Performance may be volatile as private funds may employ leverage and other speculative investment practices that may increase the risk of investment loss, and adherence to risk control mechanisms does not guarantee investment returns. Additionally, fees may offset an investor’s profits. A comprehensive list of potential risk factors is outlined in the Offering Documents.

Investing in the financial markets involves a substantial degree of risk. There can be no assurance that the investment objectives described herein will be achieved. Investment losses may occur, and investors could lose some or all of their investment and successfully overcoming barriers to entry, e.g., legal and regulatory enterprise does not guarantee successful investment performance. No guarantee or representation is made that the Fund’s investment program, including, without limitation, its investment objectives, strategies or risk monitoring goals, will be successful and investment results may vary substantially over time. Investment losses may occur from time to time. Nothing herein is intended to imply that the Fund’s investment methodology should be considered “conservative”, “safe”, “risk free” or “risk averse.” An investment in any fund should be discretionary capital set aside strictly for speculative purposes.

Certain information contained in this document contains: forward-looking statements” which can be identified by the use of forward-looking terminology such as “may”, “will”, “should”, “expect”, “anticipate”, “target”, “project”, “estimate”, “intend”, “continue” or “believe” or the negatives thereof or other variations thereon or comparable terminology. Due to various risks and uncertainties, actual events or results or the performance of the Fund may differ materially from those reflected or contemplated in such forward-looking statements. Forward looking information is subject to inherent uncertainties and qualifications and could be based on numerous assumptions. Forward looking information is provided for illustrative purposes only and is not intended to serve as, and must not be relied upon by any investor as, a guarantee, an assurance, a prediction or a definitive statement of fact or probability.

Performance Methodology: Past performance is not an indicator of future performance. Annualized Returns or Performance figures for True Partner Fund are based on Class B shares and are shown on a net basis after the deduction of a 2% management fees and a 20% performance fee, trading related and other expenses that an investor would have or actually paid.

The indexes’ performances do not reflect the deduction of transaction costs, management fees, or other costs which would reduce returns. References to market or composite indexes, benchmarks or other measures of relative market performance (indexes) over a specified period of time are provided for your information only and do not imply that a portfolio will achieve similar returns, volatility or other results. The composition of an index may not reflect the manner in which a portfolio is constructed in relation to expected or achieved returns, portfolio guidelines, restrictions, sectors, correlations, concentrations, volatility or tracking error targets, all of which may change over time. Indexes are used as performance benchmarks only, as True Partner does not attempt to replicate an index. The composition of the indexes is not necessarily similar to accounts managed by True Partner. The prior performance of the indexes will not be predictive of the future performance of accounts managed by True Partner. An investor may not invest directly in an index.