
May 2023, Chicago/Hong Kong
The proverb ‘beauty is in the eye of the beholder’ has rung true for ages since it first appeared in 3rd century BC Greece, stemming from the philosophical discussion as to whether beauty is an objective or subjective concept. Ultimately, the proverb tells us about perspective. People see what they like to see and more importantly tend to close their eyes for what they don’t want to see, as beautifully captured in the popular 2021 Oscar-nominated movie “Don’t look up”. One of the great masters of perspectives was the famous Dutch artist Escher. In his work and in his own words: “Things are uncertain and can be seen in two different ways: a floor is also a ceiling; an interior is also an exterior; convex is concave at the same time.” (from ‘Escher on Escher: Exploring the infinite’). We find confusing perspectives are not limited to the realm of the arts as the current state of the financial markets bear some resemblance to the works of Escher. Are we at the foothills of a continued climb higher, or on an overhang, about to fall into an abyss?
An impressive market rally…
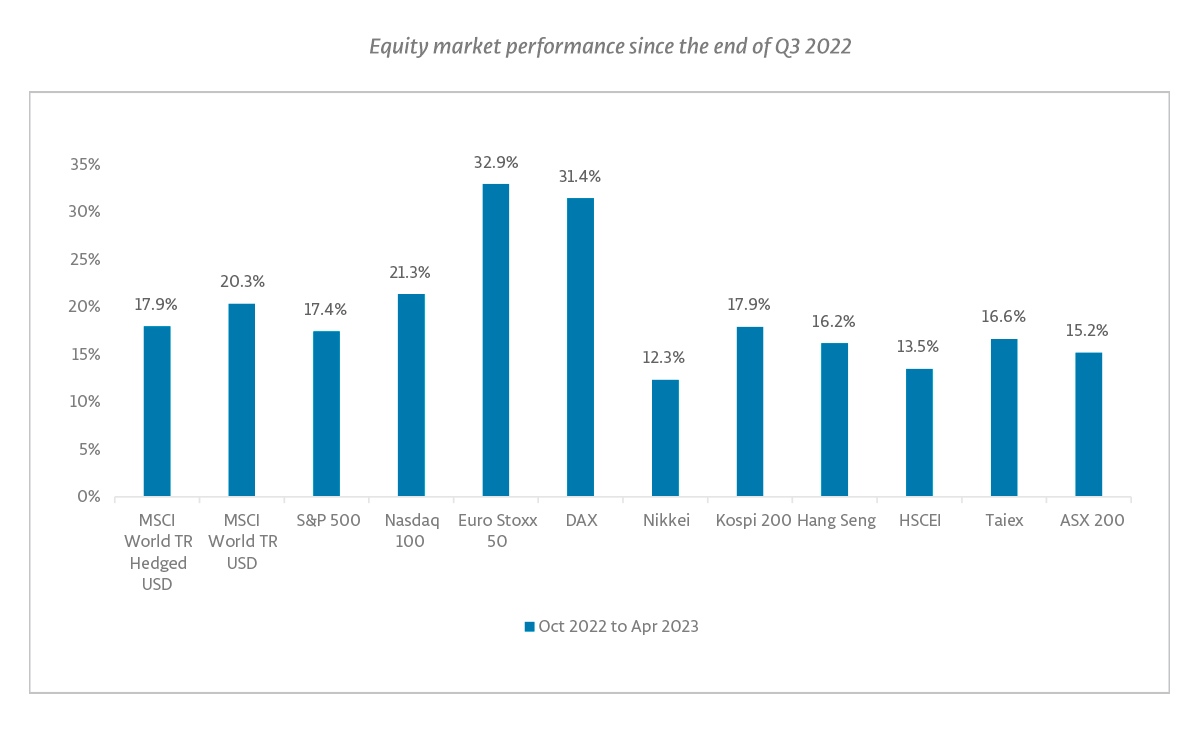
As we highlighted in our Q1 update call in April, recent market performance has been impressive. Adding on to a rally in the fourth quarter of 2022, markets had a buoyant start to 2023 with the Nasdaq even posting its best January since 2001. Since the end of September 2022 markets across the world have logged material gains, with all major indices up double digits in local currency terms. Through the end of April, the MSCI World Index (Total Return, hedged to USD) has gained +17.9%, the S&P 500 (total return) was up +17.4% while the Euro Stoxx 50 (total return) managed to climb +32.9%. The Nikkei was a relative laggard, up +12.3%, but that was enough to recover more than all its 2022 losses. The Euro Stoxx 50 was also up +5% vs end 2021 levels, despite the Ukraine war, high inflation and rates moving significantly higher (at the end of 2021, markets were pricing rates to remain around zero in Dec 2023; as of April 2023, markets were pricing Dec 2023 rates to be around 3.5%). At the same time, measures of implied volatility have cratered. Since the end of September 2022, a popular short-term VIX futures ETF has lost over half its value, down -55.7% through the end of April 2023. From the perspective of these numbers, markets may appear robust and geared for continued gains. Below we show a snapshot of markets returns over the 7 months to the end of April 2023: almost every market is up 15% or more, with the worst performer (Japan’s Nikkei) still up +12.3%.
…despite considerable headwinds
The past months have been even more remarkable given all the threats on various fronts which markets have appeared to defy. While at this moment we do not see an imminent catalyst for a market crash, we do see a range of factors which we believe are major headwinds for equity markets in general and US markets in particular. These factors range from lingering, longer term developments to detractors that are increasingly current and out in the open. Inflation remains persistent, as do the troubles at small and medium US banks. Central banks appear committed to their belief that restrictive monetary policy is required, just when the US consumer appears to be tapped out having exhausted the excess liquidity stemming from Covid relief. The geopolitical situation remains precarious, while in the US the recurring high stakes political game of chicken surrounding the Debt Ceiling has kicked off again. With that in mind, market valuations and volatility levels provide quite a disconnect with the world outside of our market screens. But that disconnect also provides not just a volatility environment which in our view is more interesting now than it has been for the past years, but also an ideal opportunity for all investors who might not be fully sold on the positivity, to hedge downside exposure, while retaining market upside.
In this article, we will run you through these headwinds and subsequently circle back to the current volatility environment, the opportunities which it provides and provide some characteristics as to where we see challenges and interesting prospects for investors.
Inflation and higher rates
To start off with inflation, arguably the market’s main nemesis in 2022, this remains broad-based and persistent. Both in the US and in Europe, inflation has receded from earlier peaks reflecting the easing of logistical bottlenecks and, in Europe, also reflecting the mild winter which averted an energy crisis. But regardless, inflation remains well above target levels and central banks have generally continued to revise their inflation forecasts higher.
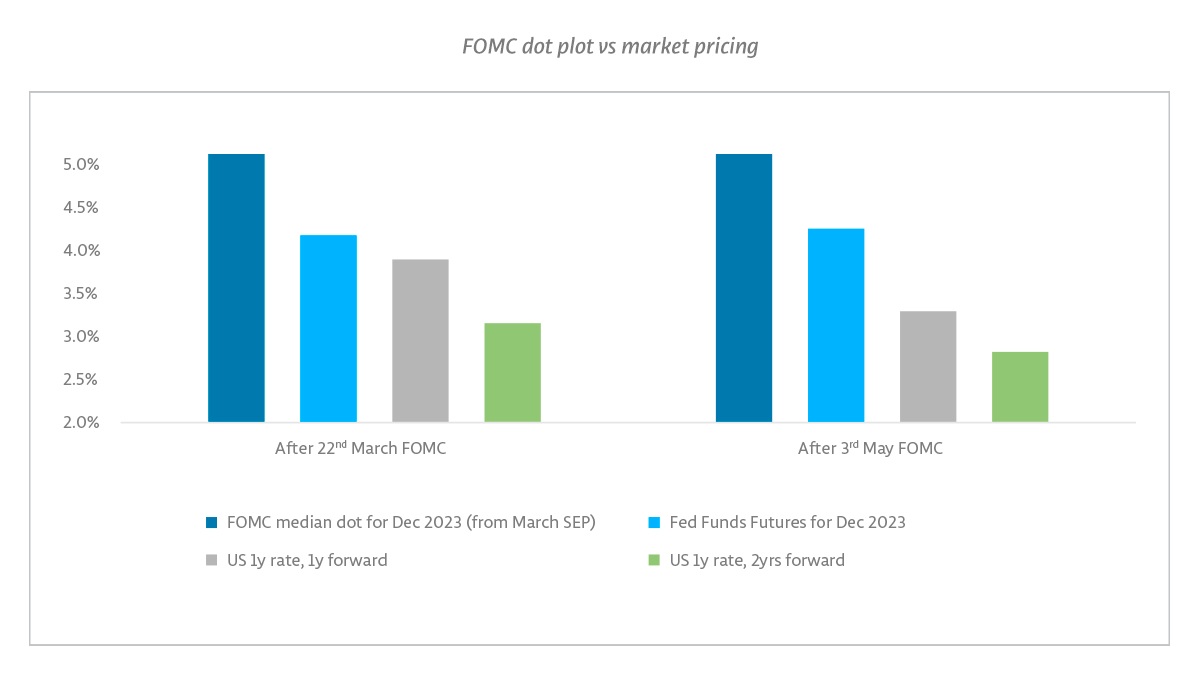
In Europe, declines in energy costs have softened headline forecasts but there has been continued pass-throughs of inflation at the core level, with core inflation forecasts continuing to rise as we highlighted on our Q1 update call in April. Net, the ECB looks set to continue its hiking path. Meanwhile, US markets remain in the thralls of Goldilocks, expecting a gentle slowdown which would suffice for early rate cuts but would not be of a magnitude to cause a recession. An increase in strikes and higher wage demands also point to a nascent wage-price inflationary spiral. Markets have reacted in a remarkably muted way to various datapoints opting for the positive perspective: inflationary readings alleviate the risk of recession whereas readings indicating economic slowdown support a quick easing of rates. At the March FOMC (22nd March, just after the Credit Suisse/UBS deal), the FOMC Summary of Economic Projections, better known as the dot plot, showed participants expected rates to be at 5.125% at year-end in their base case. Markets were more dovish, pricing in rates to be almost 100bps lower. Following the May FOMC (3rd May), at which the Fed hiked rates to 5.125%, market pricing for year-end is similar, with around two rate cuts priced by January 2024. The market is pricing another set of cuts in 2024 to bring rates quickly back down to around 3%.
A plethora of banking troubles
Equity markets moved on remarkably quickly from what now in hindsight can be called the mini-banking crisis in March, with the S&P 500 up +3.7% in March and a further +1.6% in April despite the collapse in March of several banks, most notably Silicon Valley Bank, an orchestrated rescue for Credit Suisse and then over the weekend at the end of April the collapse of First Republic, whose corporate bonds are pricing almost zero recovery post the rescue as we write.
However, when assessing the impact of rates on the economy, the bank collapses will likely cast a shadow forward. As referenced by Chairman Powell during the March and May FOMC press conferences, an important impact of the mini-banking crisis is an overall reduction in the availability of credit, which has a similar effect to increasing rates, though with uncertainty around the level of equivalence. Not only will the ongoing shift of deposits to a small group of very large banks curtail lending by all other US banks, the easy availability of Money Market Funds as an alternative to low-interest checking accounts will also likely raise the cost of deposit funding, pressuring net interest margins and thus pushing higher the cost of credit across all banks.
Adding insult to injury, the small and medium US banks which are perceived to be most vulnerable to implosion of their deposit base happen to have the most significant exposure to commercial real estate, including offices. In a post-Covid world, demand for office space appears to be permanently impaired. While estimates vary, a monthly Stanford survey suggests that in January 2023 just over a quarter of paid workdays were worked from home, vs around 5% pre-pandemic, with over 10% of workers fully working from home.1 Some measures suggest even bigger drops in office working.2 The New York Times recently noted that there was 1 billion square feet of untenanted office space at the end of 2022. How big is that? About the same as 2.5x all the office space in New York.3 At the same time, more than half of the USD 2.9 trillion in commercial mortgages will need to be renegotiated by the end of 2025 and local and regional banks are on the hook for nearly 70% of these loans according to research by Bank of America and Goldman Sachs4. The share prices of real estate firms with a focus on office buildings, such as Vornado Realty Trust (NYSE: VNO) and SL Green Realty Corp (NYSE: SLG) and of real estate finance companies such as Blackstone Mortgage Trust (NYSE: BXMT) provide an impression of the magnitude of the difficulties ahead.
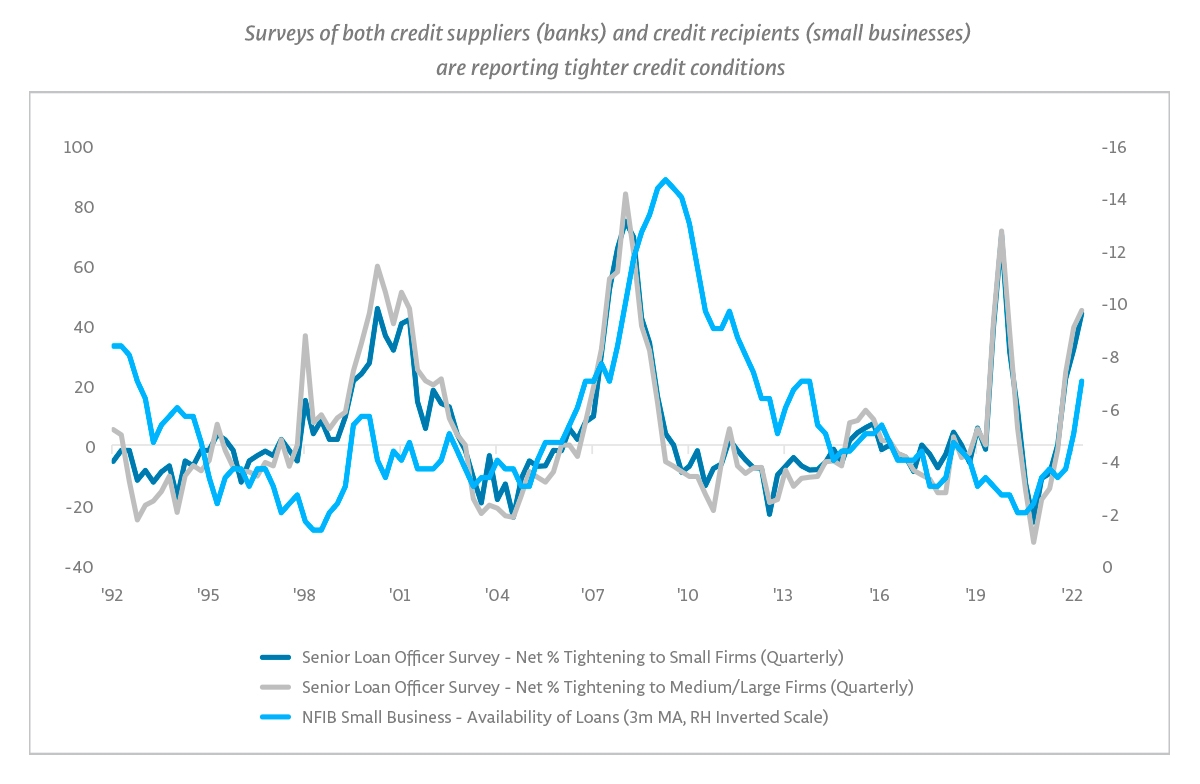
The overall reduction of available credit which Powell referenced is also visible in markers such as the Federal Reserve’s Senior Loan Officer Survey, as per the chart above. The next dissemination of the Senior Loan Official Survey, on 9 May, will be an interesting datapoint.
A tapped-out US consumer amid a slowdown in housing
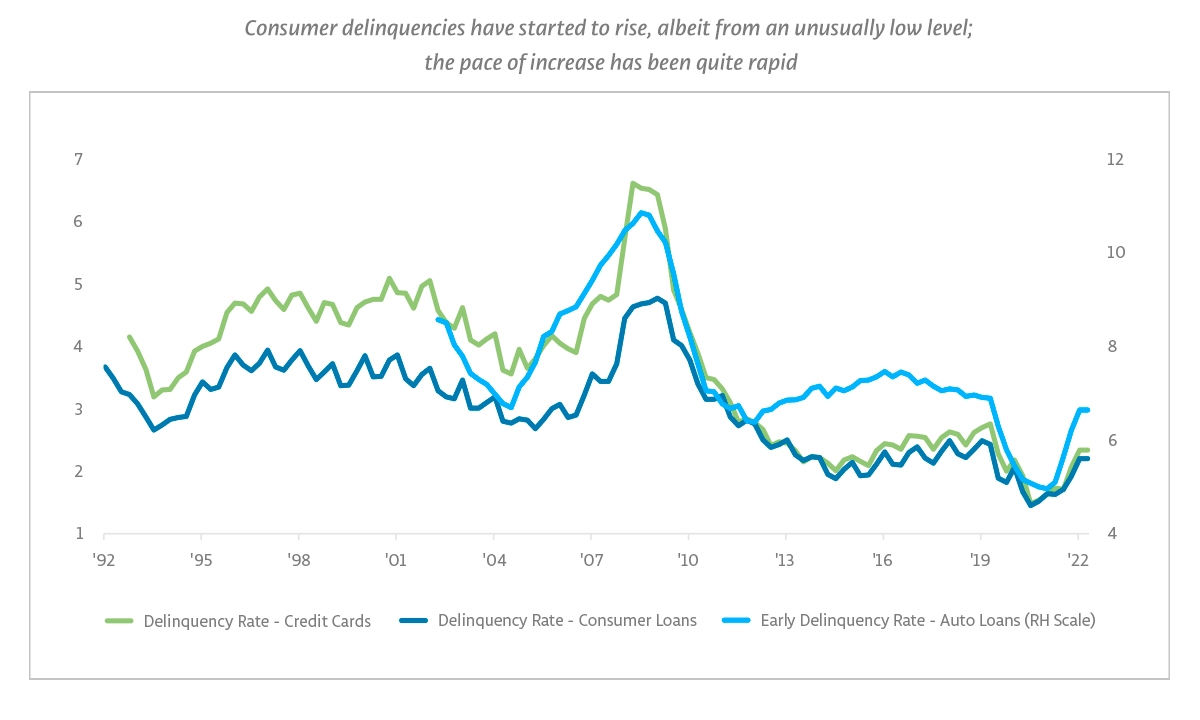
In addition to the headwinds for businesses, signs of trouble are emerging on the consumer side as well. The rise in US housing prices has reverted with the median sale price down 3.3% year-over-year in March5 negatively impacting consumer equity. US real estate data on 27th April painted a further gloomy picture, with pending home sales down 5.2% month-on-month in March and over 20% year-on-year. Any reduction in credit would impact the US consumer just at a time when the reserves dating from the Covid relief packages have dwindled and relief measures are rolling off. Consumer delinquencies have started to rise, albeit from unusually low levels with notably the delinquencies in auto loans rising sharply. The US consumer, whose resilience has been a positive driver of market sentiment post-Covid appears increasingly under threat of being tapped out. The downside surprise in Q1 GDP data – which came in at 1.1% annualized vs. 1.9% consensus – is another worrying sign.
Geopolitical risk and de-globalization
Besides the tug of war between inflation and an economic slowdown, the troubles in the banking sector and more restrictive policy actions by the world’s main central banks, the overall geopolitical picture remains grim as well. The ongoing conflict between Ukraine and Russia, while mostly out of the main headlines, remains in flux and the potential for sizeable collateral damage remains, not limited to Europe’s largest nuclear power plant. But a secondary effect from that conflict is the continued wedge it creates between countries and regions, increasingly pitting the Western developed nations against Russia and its allies, while China, India, Brazil and Saudi Arabia could be construed as wildcards on the sidelines. The process of de-globalization which was already taking place prior to the conflict has been amped up in speed and magnitude. Sanctions are one obvious element of this, but there are also more subtle signs of policy shifts that will have long-term effects. We believe that this creates long-term inflationary headwinds, a point that is increasingly a discussion topic in policy circles, as evidenced by ECB President Christine Lagarde’s recent speech, where she noted that ECB analysis suggests that geopolitically driven fragmentation of global value chains could lead to up to a 5% rise in consumer prices in the short-run and roughly 1% in the long-run.6
The unity of the Western alliance supporting Ukraine may also come under threat. Recent miscues by President Macron (regarding Taiwan) and by Presidential hopeful DeSantis (regarding Ukraine) suggest that levels of support could come under pressure in the future. Politics across the western democracies have grown more polarized, with the US reaching an alarming level of dysfunction. And US politics brings us to the current 500-pound (or rather 31.4 trillion dollar) gorilla in the room: the US debt ceiling.
The US Debt Ceiling debate
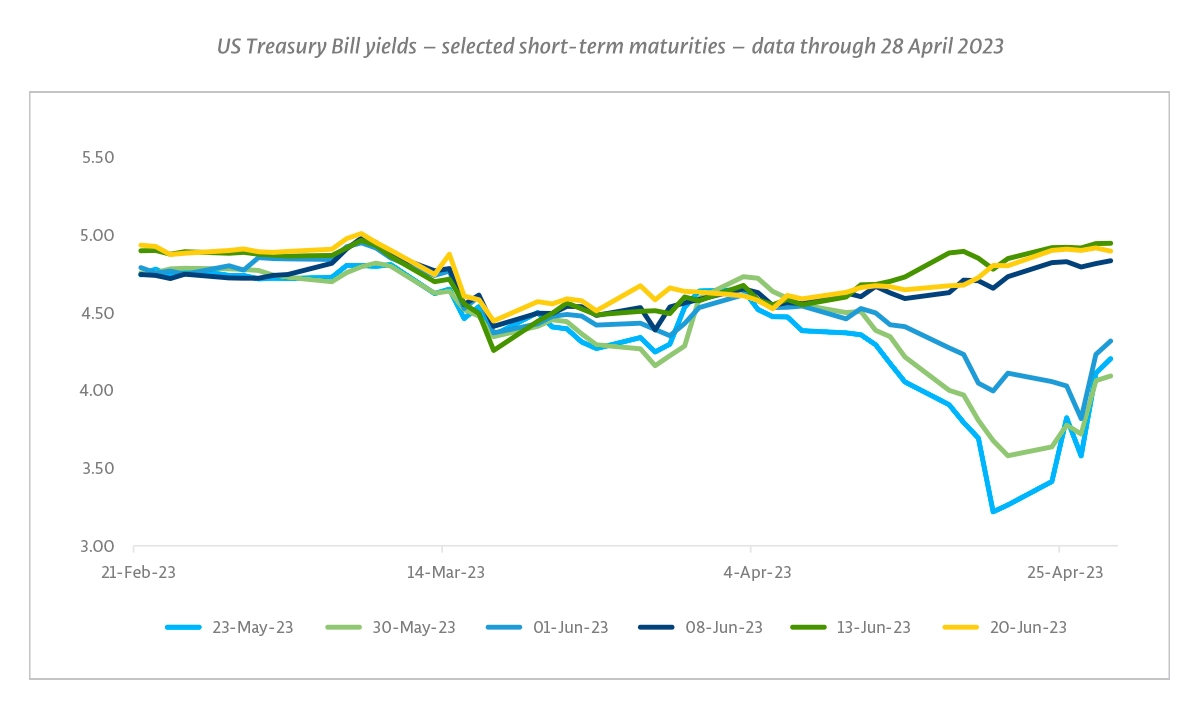
While we do not see an imminent probable reason for a market crash, the debt ceiling is clearly one such risk. While theoretically these standoffs are easily solved and so default is highly unlikely, market disruption can occur even without a default if that prospect gets sufficiently close. Remember that only when it came down to the wire in 2011, 2012 and 2013 did common sense finally prevail. And past performance is no guarantee for future results as the level of polarization in general, combined with the razor-thin majorities of the Republicans in the House and Democrats in the Senate make a timely fix anything but a foregone conclusion. And time is of the essence. While the so-called X-date (at which the extraordinary measures run out and the US Government might potentially default on its obligations) was initially expected to fall in the summer, less-than-expected tax revenue was always a risk as having the effect of pushing that date forward into early June. Now that this risk appears to have materialized, an early X-date is very much in focus. Stress is visible in fixed income and credit markets, but not in equities. For example, USA 1-year CDS, which pay out in EUR, were trading at around 177bps at the end of April; for comparison, JP Morgan trades at around 46bps. The US Treasury Bill market has also been distorted: at the time of writing, 23rd May maturities were trading around 80bps below 13th June maturities, with most of that gap accounted for a gap between the 1st June and 8th June maturities – around the time the Treasury could already run out of cash.
The repercussions of a technical default remain unclear, with the risk of unintended and unexpected consequences. The recent experience in the UK is perhaps instructive, as an underestimation of collateral needs, combined with requirements to settle collateral in cash nearly blew up the market for Gilts as many large holders sought to unwind positions at the same time. In that episode it seems the requirement for cash collateral was a contractual nuance whose potential tail risks may have been overlooked by some. If the US debt ceiling comes right down to the wire, or there is a technical default, what things might be uncovered? The risk of a mishap relating to the debt ceiling is exacerbated given the essential role of US Treasuries in the global financial system. For example, US Treasuries are essential in the repo market which provides over USD 3 trillion in funding every day or in the process of exchange collateral, without which financial markets cannot function. A (technical) default may well cause the plumbing in an unexpected aspect of capital markets to become undone, cascading into a global liquidity crisis. Again, a default is unlikely, but if it is only days away, market participants will not be able to ignore the risks – which could lead to rapid positioning shifts.
Price/Earnings ratios are elevated, particularly for technology stocks
From our perspective, US valuations appear quite challenging for any scenario other than the return of Goldilocks and this especially appears to be the case for the less profitable growth names in technology. After its more than 20% rally YTD, the forward Price/Earnings ratio of the Nasdaq is currently at 26.2x which is more than 5pts above the 21x average from 2009 to present. While that is still quite shy of the levels seen during the dot-com bubble, in light of the interest rate environment the upside appears limited, with even some large stocks such as NVIDIA (around 5% of the index) already commanding an over 100x P/E. This year, the Nasdaq appeared to be sensitive to interest rate declines, proving resilient during the turmoil of mid-March, only to be remarkably immune to the interest rate rises which bookended the mini-banking crisis, in February and at the end of March. As history has shown, if the main reason for rate declines is (fears of) recession, it typically does not bode well for the valuation of growth stocks.
Looking at the broader S&P Composite index, the Shiller cyclically adjusted total return P/E ratio was at 31x at the end of March, vs a 50-year average of 24x and a longer-run average of 21x (since 1881).7 That puts valuations in the top decile of most expensive periods over the full data set, and in the top quartile of most expensive periods over the last 50 years, or a bit more expensive than stocks were coming into 2008.
Volatility overview
In summary, since our latest volatility outlook in February, and even since our quarterly update call a couple of weeks ago, if anything the proverbial plot has thickened. Both the difficulties in the US banking sector which continue to wreak havoc among all but the largest banks in the US and a possible default following a mishap in the Debt Ceiling debate can be added to the list of worries.
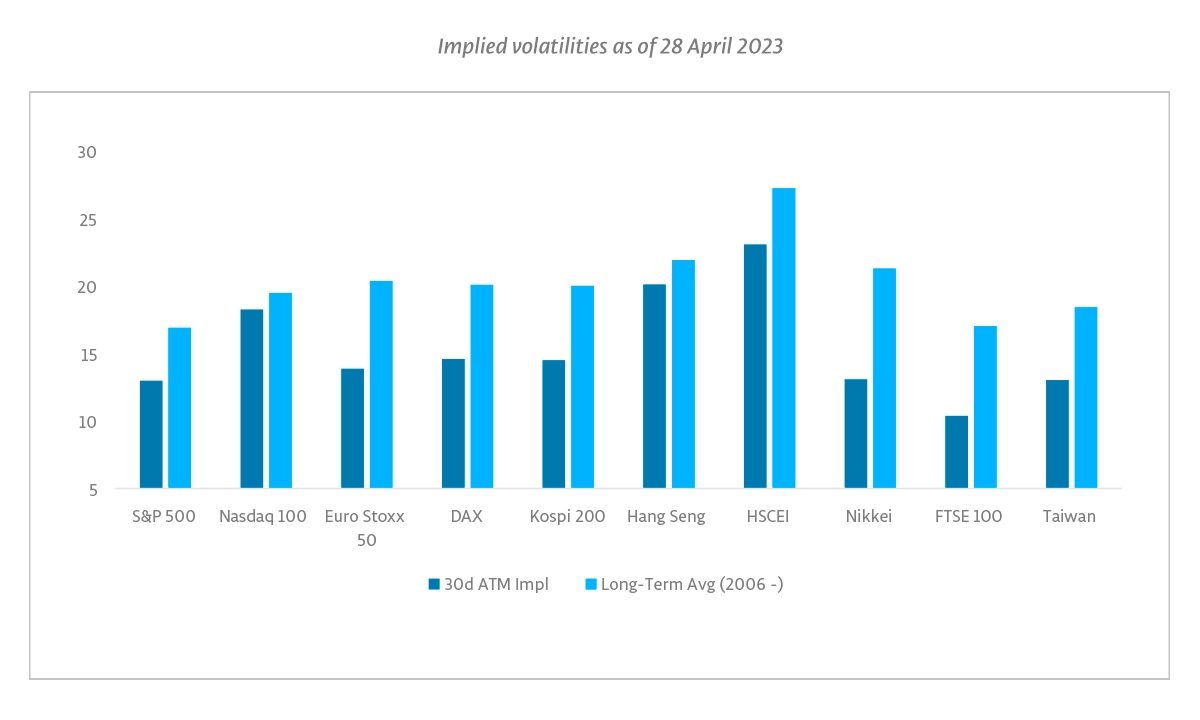
But in an apparent disconnect, the backdrop discussed in this article remains mostly invisible when seen from the perspective of the current pricing of equity volatility. Implied volatilities are trading at levels below long-term averages, in some markets even substantially so. Looking across markets, at the end of April implied volatility in several markets was in the bottom quartile of the distribution (since 2006) and in Japan it was in the bottom decile
Markets were not only positive on the forced wedding between Credit Suisse and UBS as reflected in the subsequent rise of UBS shares, but have also appeared confident that the banking crisis has been resolved despite evidence to the contrary. The collapse over the weekend of First Republic Bank, with shareholders and bondholders facing virtual wipeout illustrates the downside and May has begun with a little more nervousness. The knock-on implications for banks’ own debt will be interesting to see – could banks start to question the wisdom of holding each other’s debt given the speed and severity of the loss and correlated risks in the sector? Could money market funds begin to question the space?
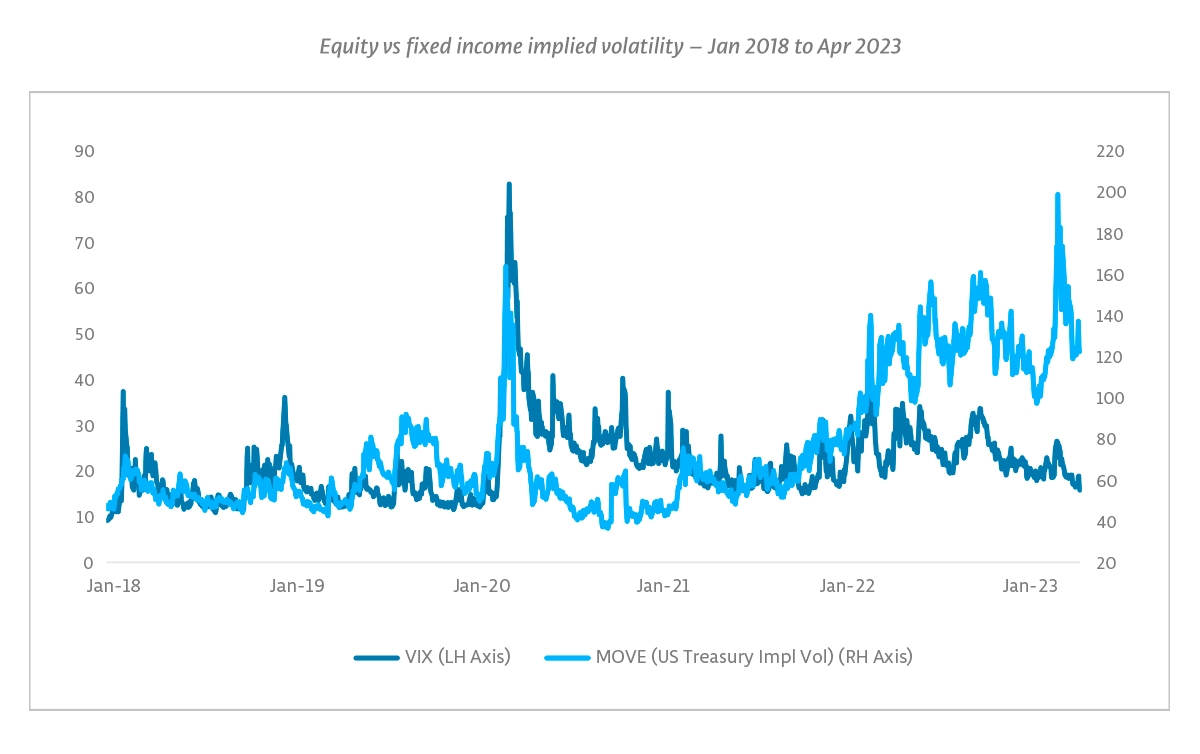
The disconnect between volatility in equity indices and that observed in other asset classes remains as stark as when we flagged it earlier this year, if not more so. In mid-March, the MOVE index which tracks the implied volatility in US Treasuries jumped to levels above those seen in Q1 2020 and even after retreating from these highs still trades at substantially elevated levels, in stark contrast to equity volatility as represented by the VIX.
Opportunities going forward
So, what should investors do? We’ll offer our perspective on the broader implications for portfolios, and then focus in with our volatility lens. Thinking about broader portfolios first, we are conscious that investors will have different starting points, and our day job is not global asset allocation – rather, we are specialists in volatility. But if we imagine running a pool of long-term capital in a multi-asset portfolio, risk assets are likely to be a big part of that. And we would suggest that there are signals coming from various quarters that all point to caution. Specifically, we believe that investors should be prepared for potential downside from their holdings in equities and credit. The reaction of government bonds also seems more uncertain than perhaps some assume, as some of the reasons for higher bond yields could remain even in a downturn.
That doesn’t mean we see an imminent and obvious catalyst for a crash – if we did, it would likely be more obvious to others too and be priced in to a greater extent. But we do see the potential for negative surprises from multiple quarters, and a sense of complacency, which is something that can more easily lead to mispricing of risks.
One of the most under-appreciated benefits of a strategy that can profit when all around are losing is the chance it gives to rebalance. If you have a strategy that delivers gains during periods of general risk asset distress, it is likely to become overweight during that period, while risk assets may become underweight following losses. Where long-term theses are unchanged, that gives an opportunity to take profits in hedging strategies and add back to risk assets at more attractive valuations, as we saw in 2008/early 2009 and in 2020, and to a lesser extent after years like 2018 and 2011 and periods such as summer 2015. This can have a huge effect over time due to compounding benefits. Explicit tail hedges are an obvious source of such gains, and the same logic can also be applied to other types of negatively correlated strategies with less dramatic tail scenario profits.
Turning to volatility markets, and in the context of current pricing, the macro backdrop signals to us that we could see sudden jumps in volatility. Simply put, the potential for negative surprises seems elevated, while the amount of ‘surprise’ priced in is lower than average. We believe that augurs well for the opportunity set for volatility trading strategies that can benefit from those surprises as well as the beneficial role volatility can play as a defensive component of a broader multi-asset portfolio. Below we expand on some of the factors behind this:
Equity volatility provides favorable convexity compared to other asset classes
It is tempting to extrapolate the market and volatility behavior we saw in 2022 and the last few months. That could point towards constructing a hedge using volatility in those asset classes that have shown the largest reactivity over this period – such as fixed income. However, it’s important to have a longer historical context too. 2022 was unusual for the disconnect between equity volatility and volatility in other assert classes. The current elevated pricing of volatility in several asset classes impairs two key aspects of viability. Firstly, entering hedges at high levels of implied volatility makes hedges very costly to maintain; secondly, higher implied volatility means more movement is already priced in, so such positions also generally lack the degree of convexity to create a favorable pay-off. As a result, to provide sizeable convexity from already elevated levels of volatility, a truly cataclysmic movement would have to occur.
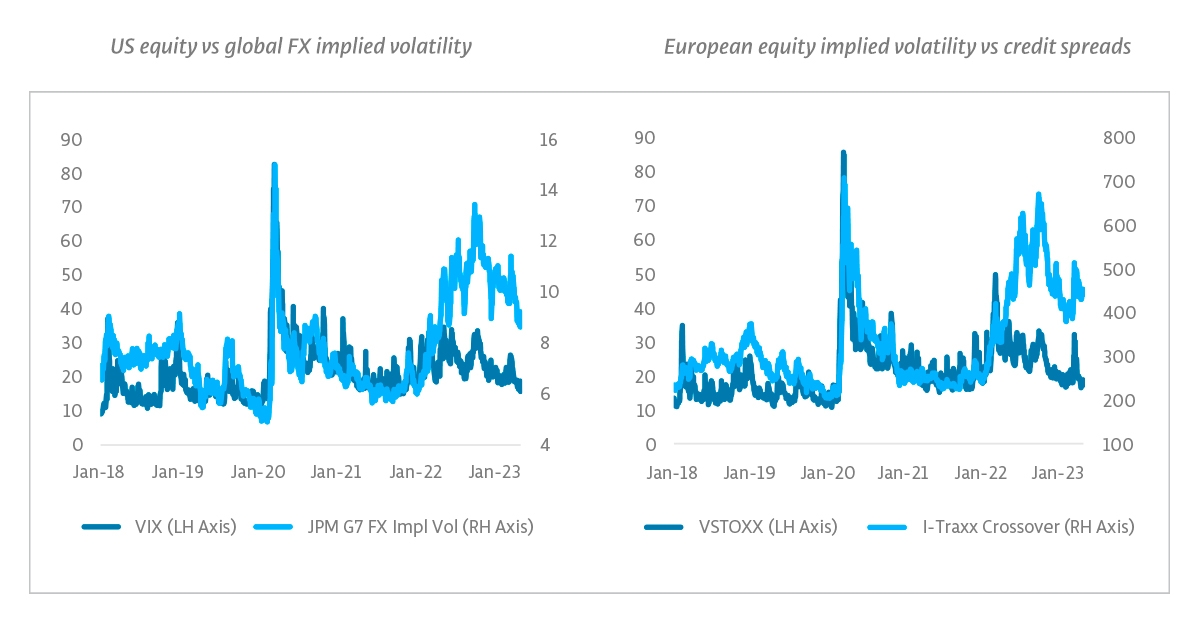
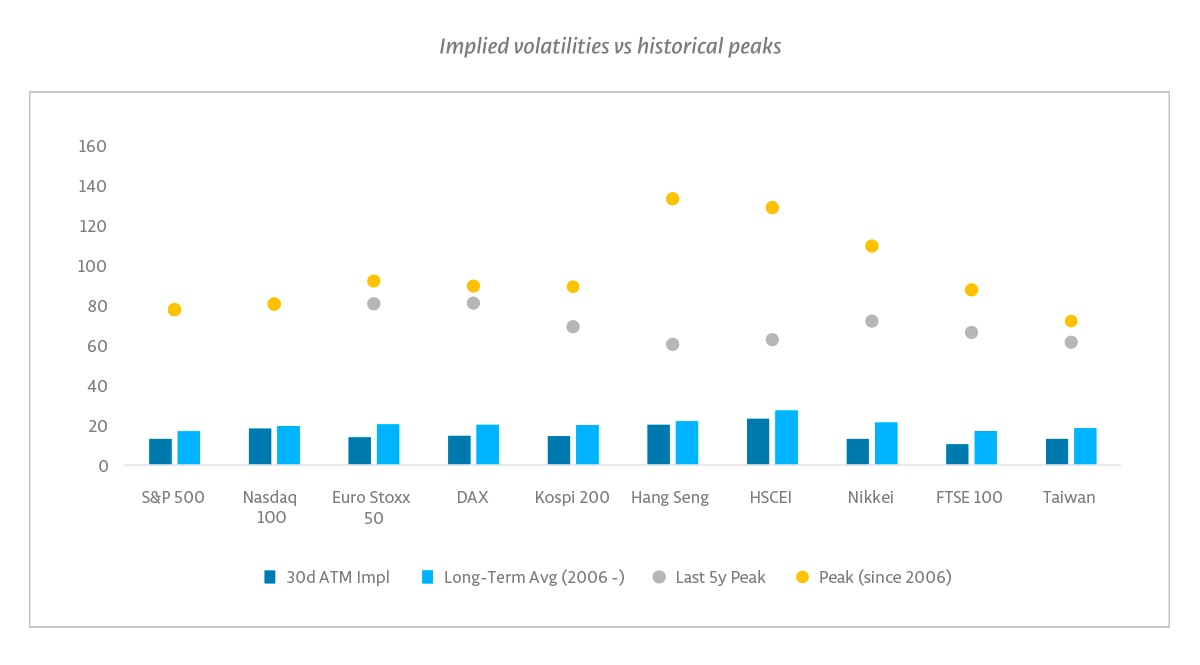
In today’s interconnected market, should such an outsize magnitude event occur in for example fixed income markets, we believe that it would be highly likely equity markets would be significantly impacted as well, allowing equity volatility to catch up. A violent catch-up from more muted volatility levels provides exactly the degree of convexity from which larger pay-offs are built. And comparing current volatility levels with earlier peak levels shows the room equity volatility has in such a catch-up. We showed equity vs fixed income volatility in the US; above we show some additional comparisons vs FX volatility and credit spreads to illustrate that this point can be seen in multiple measures. We then show current levels of equity implied volatility vs historical peaks – which shows what can happen in a major risk off move.
Realized volatilities are an important factor to consider, while curves remain relatively flat in some markets
One driver of the disconnect between equity volatility and that of other asset classes has been the lower degree of day-to-day movement. While still some way above the all-time lows hit in 2017, realized volatilities are generally below their long-term averages. As shorter dated options are more vulnerable to a shortfall in day-to-day movement, hedgers tend to gravitate to longer dated series. While generally the costs associated with longer maturities rise along a (steeply) upward sloping volatility curve, in some markets the term structure is currently reasonably flat, especially so in light of the relatively low absolute levels of implied volatility which tend to be associated with (far) more steeply upward sloping curves. At the end of April for example, for Korea’s Kospi index the differential between the June expiry (8 June, ATM of 13.7) and the September expiry (14 September, ATM of 14.4) was 0.7 volatility point, while for the Euro Stoxx 50 index the differential between the June expiry (16 June, ATM 14.9) and the September expiry (15 September, ATM 16.6) was 1.7 points.
Reactiveness is picking up
One main detriment for equity volatility hedges in 2022 was the limited reactiveness of implied volatility on market declines (and at times, implied volatilities even declined amid market declines as happened in December). From that perspective, the changes in per-strike volatility (as well as in the VIX futures contract) over the mini-banking crisis in mid-March were interesting. Whereas volatility changes remained at a much lower magnitude compared to declines in earlier years, they did show more reactivity than seen in much of 2022. Furthermore, during that episode the start of contagion was visible between implied volatilities of different indices across the globe. While market sentiment quickly turned positive again in March, we believe that this points to a further normalization of volatility behavior after the anomaly of 2022.
Higher cash rates make cash efficient solutions more attractive
In the long period of ultra-low interest rates, having a cash efficient, liquid strategy did not make a big difference, as the opportunity cost of tying up capital was low. This was one factor behind the big migration towards less liquid assets offering yield. Now, with cash once again offering a reasonable yield and borrowing costs more elevated, we believe that cash efficiency is an under-appreciated benefit. A strategy that be implemented opportunistically and via cash efficient derivatives can free up cash that can be used to fund other strategies, or can itself be combined with efficient cash management in high quality government securities.
What can investors do?
We believe we are likely to see a return to the kind of historical behavior where we have seen bigger opportunities for volatility trading. At True Partner, we expect this to benefit our relative value strategy and also see an opportunity for investors with risk asset exposure to enter more directional volatility hedges at some of the most attractive levels we’ve seen since before the volatility spike in early 2020.
Our relative value volatility strategy has a long history over more than a decade of portfolio management and finding opportunities in market surprises, as shown by performance in periods such as Q1 2020, Q4 2018, Q1 2018 and summer 2015. However, by design it has limited net vega exposures and deploys risk very opportunistically. For those seeking more directional exposure to volatility or payoffs tailored to match the downside risks of their specific portfolio exposures, we believe it could be an opportune time to also consider customized solutions where we can deploy a range of strategies including outright hedges, opportunistic long volatility strategies and relative value approaches. The overall combination can be tailored to make the risk/return profile more focused on returns and alpha in specific scenarios, and/or particularly complimentary to the rest of an investor’s portfolio.
In the face of changing market dynamics, we believe investors should also consider a premium for liquidity in this environment, which gives the ability to change one’s view without incurring significant costs through high spreads or delay. With many investors having larger private market allocations than in the past, this could prove particularly valuable. For example, applying hedges in liquid instruments such as listed derivatives can enable smooth modifications of hedges when needed, and more predictable pricing during stress periods, where realizing the P&L of more opaque hedges can be more challenging.
We believe there is also a benefit of a 24-hour, global trading set up such as that at True Partner Capital, where you have senior personnel in different time zones. This gives us the ability to screen positions across diverse markets over the trading day in each of Asia, Europe and the US. Of course, market participants use models to monitor markets and identify opportunities as we do, but we believe that experienced human traders can also add valuable context, particularly in the biggest volatility events. There is a small sample size of such events for models to work from and the specific catalysts for the big moves change. Having decades of experience of being in markets every day can add value in such cases, while fully automated decision making may struggle. Being truly global also gives a real timing benefit that can help capture opportunities, as senior decision makers are available and ready to make decisions quickly, whatever time this occurs.
Net, we see an interesting opportunity set ahead for equity volatility trading, with attractive pricing relative to the macro backdrop and other asset classes. While tail risks of course may pass unrealized, and markets continue higher, history suggests that can also be a dangerous assumption. While an approach of “Don’t look down” can make one feel braver, it doesn’t remove the potential risks of the drop. We believe that having appropriate diversifiers for tail scenarios can help to provide a robust portfolio that can weather both good times and bad. This can enable investors to take appropriate risks in rising markets, while also positioning them to take advantage of the opportunities stressful periods can bring to take profits in hedges and reposition at attractive prices. We believe at current levels of volatility, and given the current backdrop, one doesn’t need to be bearish to justify adding more strategies that can offset downside risks in risk assets. Or just don’t look down…
–––––––––––––––––––––––––––––––
About the authors

Mr. Govert Heijboer, Co-CIO of True Partner, has been active as a market maker trading in the European and Asian derivatives markets as well as positional trading since 2003. Govert started as a trader/researcher at Saen Options in Amsterdam and rose to become the director of derivatives trading and a member of the executive team in 2007. In 2008 he moved to Hong Kong to set up and assume responsibility for all trading activities in the new Saen Options Hong Kong branch office. Govert holds a PhD in Management Science and an MSc in Applied Physics from the University of Twente, Netherlands. He is a founding partner and has worked on the launch of the True Partner Fund since March 2010.

Mr. Tobias Hekster, Co-CIO of True Partner, has been actively trading for the past 24 years in various different roles in several markets across the globe. Starting at IMC in 1998 as a pit trader in Amsterdam, Tobias has established the off-floor arbitrage desk, headed the Chicago office in the transition from floor trading to electronic trading and set up the Asian volatility arbitrage desk in Hong Kong. Tobias holds an MSc in Economics from University of Groningen, Netherlands. Next to his role as Senior Strategist, he taught as an Adjunct Associate Professor at the Chinese University of Hong Kong and as an Adjunct Professor of Financial Practice at National Taiwan University.

Mr. Robert Kavanagh, CFA, Head of Investment Solutions of True Partner, has been in the hedge fund industry since 2004 and joined True Partner in 2019. Prior to joining True Partner he was an Executive Director at Goldman Sachs Asset Management where he spent 15 years within the Alternative Investments & Manager Selection (AIMS) group. Robert has extensive experience investing in hedge funds and working with a wide range of hedge fund investors. Robert is a CFA charterholder and holds a First Class (Honours) BSc in Philosophy and Politics from the University of Bristol, UK, where he was awarded a Social Sciences Scholarship.
–––––––––––––––––––––––––––––––
The publication of this article is available as a PDF. Download it following the link below:
Don’t look down>>
–––––––––––––––––––––––––––––––
1. Source: Survey of Working Arrangements and Attitudes (SWAA), wfhresearch.com. This survey is based on the original paper: Barrero, Jose Maria, Nicholas Bloom, and Steven J. Davis, 2021. “Why working from home will stick,” National Bureau of Economic Research Working Paper 28731. wfhresearch.com
2. ‘Do we know how many people are working from home’; New York Times, 30 March 2023 nytimes.com
3. Based on statistics from the New York Times: nytimes.com; and nytimes.com
4. Concerns Grow as Tighter Lending Threatens Commercial Real Estate; New York Times, 6 April 2023
5. Source: Redfin
6. ‘Central banks in a fragmenting world’; Speech by Christine Lagarde, President of the ECB, at the Council on Foreign Relations’ C. Peter McColough Series on International Economics, New York, 17 April 2023 ecb.europa.eu
7. Sources: True Partner, Robert Shiller / Yale Economics Department
- Investment Advisory in the new Space and AI age
- ”He will win who knows when to fight and when not to fight"
- Are we heading to a new ICE Age?
- AI Top or Slop: When Markets Reach Peak Magnificence
- The Hedge Fund Journal features True Partner's award-winning volatility strategies
- True Partner Fund wins award for strong performance
- True Partner releases new thought piece focused on Dutch pension funds
- True Partner Fund nominated for best performing relative value fund
- Bloomberg article highlights True Partner’s strong performance in April and year-to-date
- Bloomberg Publication: True Partner Volatility Hedge Fund Gains 5.9% During April Rout
- More news articles >
- Go to events >